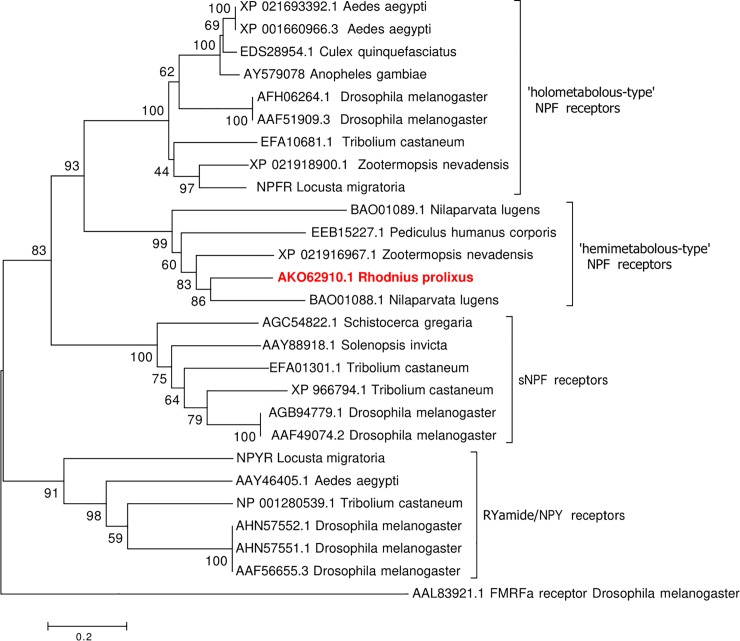
Fig 4. Phylogenetic analysis of RhoprNPFR with related receptor sequences from other insects, including members of the NPF and sNPF receptor families.
A rooted phylogenetic tree depicting the receptor sequence relationship inferred using the neighbour-joining method. The numbers at each node represent the percentage of replicate trees in which the associated receptor sequences clustered together in the bootstrap test (1000 replicates). The tree is drawn to scale, with branch lengths representing the evolutionary distances, which are in the units of the number of amino acid substitutions per site. The final analysis involved 223 amino acid positions with all positions containing gaps and missing data being excluded from the analysis. Each receptor sequence is represented by the GenBank accession numbers and species name from which the sequence originated.

