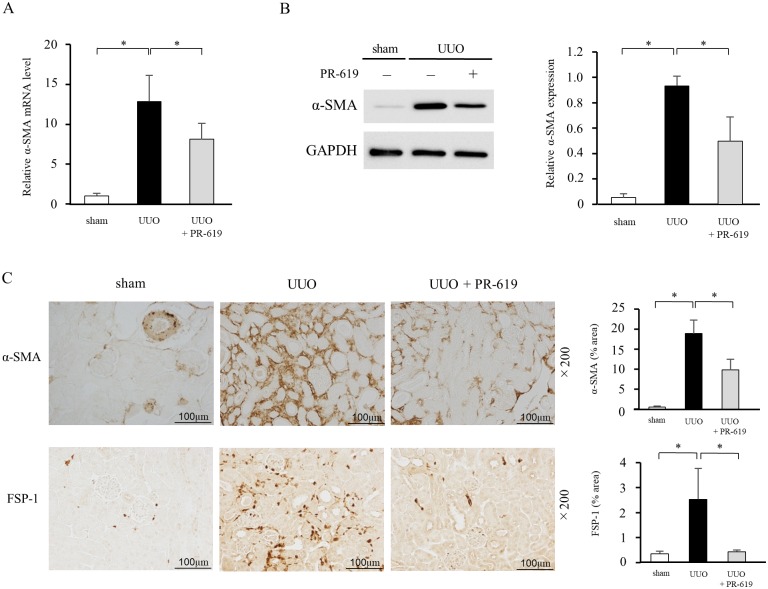
Fig 2. PR-619 ameliorates expression of mesenchymal markers in the kidneys of mice with UUO.
Kidney samples were collected from mice with UUO after vehicle or PR-619 treatment and examined for expression of α-SMA and FSP-1 as mesenchymal markers. (A) α-SMA mRNA levels were determined by qRT-PCR in mice with UUO with or without PR-619 administration. GAPDH was used as an internal control. (B) Typical western blot analysis demonstrating the level of α-SMA protein expression. The graph shows the expression level quantified by densitometry and normalized to GAPDH. (C) Representative images showing immunostaining for α-SMA and FSP-1. Quantification is shown in the right panel. Values are expressed as the mean ± SD. Statistical analysis was performed using ANOVA followed by Tukey’s post hoc test. *P < 0.05, n = 5 mice per group. UUO, unilateral ureteral obstruction; α-SMA, α-smooth muscle actin; FSP-1, fibroblast-specific protein-1; qRT-PCR, quantitative real-time RT-PCR; GAPDH, glyceraldehyde 3-phosphate dehydrogenase; SD, standard deviation; ANOVA, analysis of variance.

