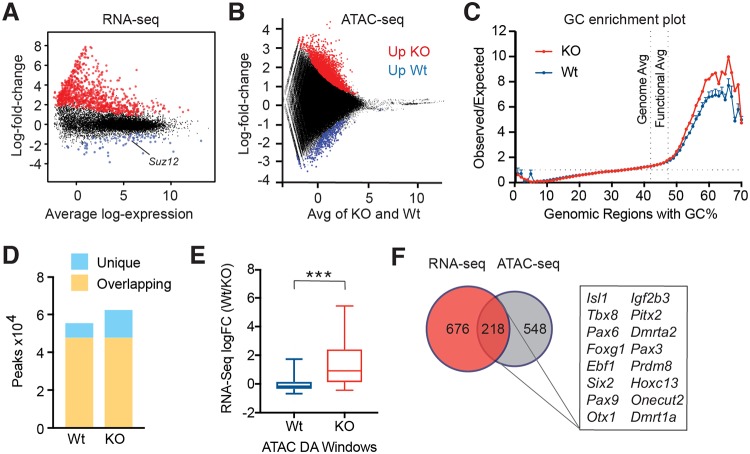
Fig 4. Suz12 deletion in basal-derived organoids results in changes in chromatin accessibility and de-repression of transcriptional programs.
(A) MD plot showing log2-fold expression changes versus average log2-expression identified by RNA-seq in Suz12-deleted basal-derived organoids compared with Wt organoids. Up- and down-regulated genes with changes significantly greater than 1.5-fold are highlighted in red and blue, respectively (Treat-FDR < 0.05). Suz12 expression is indicated. (B) MD plot showing windows identified by 150 bp tiling as significantly DA by ATAC-seq analysis of Suz12-deleted basal-derived organoids, compared with Wt average log-expression. Windows that were significantly up- or down-regulated are shown in red or blue, respectively. (C) A plot showing GC nucleotide enrichment in genomic regions of ATAC-seq reads of Suz12-deleted basal-derived organoids, compared with Wt. Shown is the average of the genome and functional DNA elements in the mouse genome. (D) MACS Peaks calling analysis of Suz12-deleted basal-derived organoids (KO), compared with Wt. (E) Box and whisker plot of DA genes found to be associated with windows found in (B) by ATAC-seq analysis of Wt and Suz12-deleted basal-derived organoids (KO), and their corresponding expression by RNA-seq analysis. Whiskers represent the 5%–95% intervals. *** P < 0.0001 (unpaired t test, Welch’s correction). (F) Venn diagram showing the overlap in up-regulated DE genes identified by RNA-seq and DA genes by ATAC-seq in Suz12-deleted basal-derived organoids. Individual quantitative observations can be found in S6 Data. ATAC-seq, assay for transposase-accessible chromatin using sequencing; DA, differentially accessible; DE, differentially expressed; FDR, false discovery rate; KO, knockout; MACS, model-based analysis of ChIP-seq; MD, mean-difference; RNA-seq, RNA-sequencing; Wt, wild-type.

