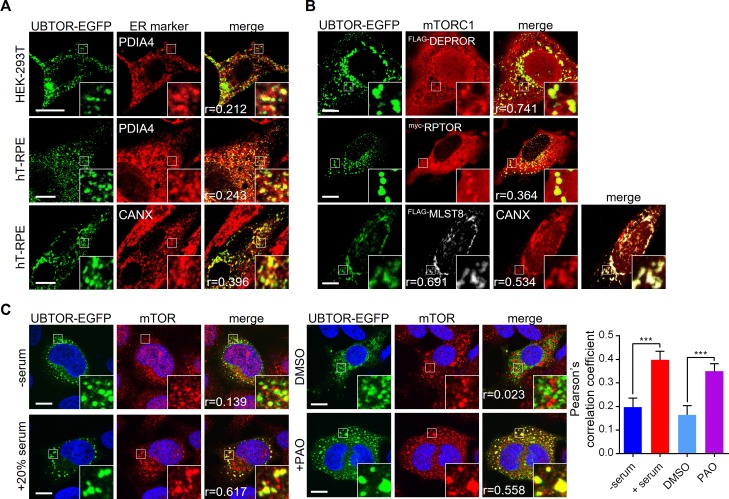
Fig 4. Subcellular localization of UBTOR and mTOR complexes.
(A) Subcellular localization of UBTOR in HEK293T and hT-RPE cells, co-stained with endoplasmic reticulum (ER) marker PDIA4 or CANX. Figure inserts show enlarged views of the boxed area. Pearson correlation coefficient or Pearson’s r values are indicated on bottom left. Representative results from three biological repeats. Scale bar, 10 μm. (B) Subcellular localization of UBTOR and mTORC1 complex components in HeLa cells. Plasmid constructs encoding FLAG-tagged DEPTOR, myc-tagged RAPTOR, or FLAG-tagged MLST8 were co-transfected with EGFP-tagged UBTOR and immunostained with FLAG or myc antibodies respectively. Pearson’s r values are indicated on bottom left. Representative results from three biological repeats. Scale bar, 10 μm. (C) Serum or PAO treatment increases co-localization of UBTOR and endogenous mTOR protein. For serum treatment, transfected HeLa cells were first serum starved overnight and then treated with 20% FBS for 1 hour. For PAO treatment, transfected cells were treated with vehicle (DMSO) or 10 μM of PAO for 15 min. Quantitative analysis of co-localization is shown on the right. Representative results from 4 biological repeats. For the serum test, t = 3.776, df = 44, P = 0.005. For the PAO test, t = 3.742, df = 59, P = 0.0004. Scale bar, 10 μm.

