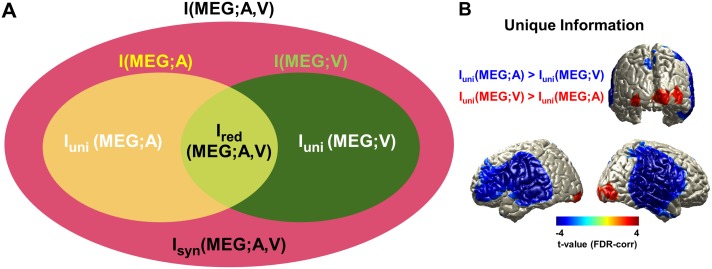
Fig 1. PID of audiovisual speech processing in the brain.
(A) Information structure of multisensory audio and visual inputs (sound envelope and lip movement signal) predicting brain response (MEG signal). Ellipses indicate total mutual information I(MEG;A,V), mutual information I(MEG;A), and mutual information I(MEG;V); and the four distinct regions indicate unique information of auditory speech Iuni(MEG;A), unique information of visual speech Iuni(MEG;V), redundancy Ired(MEG;A,V), and synergy Isyn(MEG;A,V). See Materials and methods for details. See also Ince [15], Barrett [21], and Wibral and colleagues [22] for general aspects of the PID analysis. (B) Unique information of visual speech and auditory speech was compared to determine the dominant modality in different areas (see S1 Fig for more details). Stronger unique information for auditory speech was found in bilateral auditory, temporal, and inferior frontal areas, and stronger unique information for visual speech was found in bilateral visual cortex (P < 0.05, FDR corrected). The underlying data for this figure are available from the Open Science Framework (https://osf.io/hpcj8/). Figure modified from [15, 21, 22] to illustrate the relationship between stimuli in the present study. FDR, false discovery rate; MEG, magnetoencephalography; PID, partial information decomposition.

