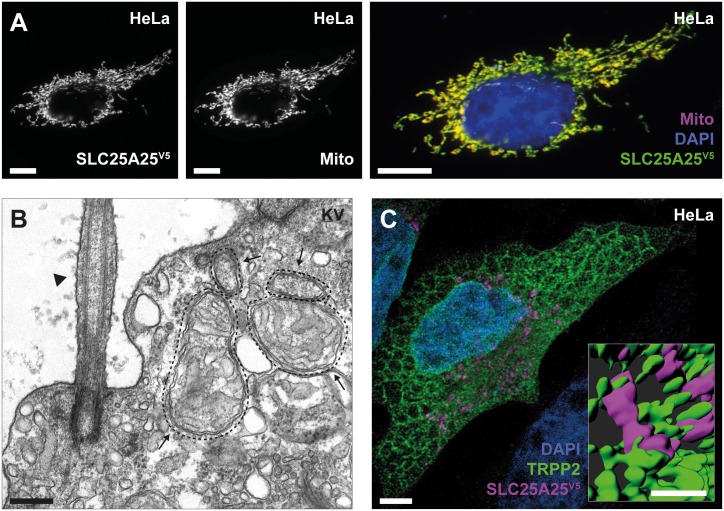
Fig 5. TRPP2 and SLC25A25 form a signaling microdomain.
(A) Indirect immunofluorescence of SLC25A25V5 showed colocalization with the mitochondrial marker pDsRed2-Mito (scale bar = 10 μm). (B) Transmission electron microscopy of a ciliated cell from KV (arrowhead: cilium; arrows: mitochondria; scale bar = 200 nm). Representative of 3 images with a similar pattern. (C) Indirect immunofluorescence of SLC25A25V5 (magenta) and TRPP2 (green) showed tight spatial coupling of both proteins at ER–mitochondria junctions in epithelial cells using STED microscopy (scale bar = 5 μm; inset = 1 μm). The inset shows 3D rendering of a magnification depicting close contacts between the ER and mitochondria (scale bar = 1 μm). ER, endoplasmic reticulum; KV, Kupffer’s vesicle; SLC25A25, solute carrier 25 A 25; SLC25A25V5, V5-tagged SLC25A25; STED, stimulated emission depletion; TRPP2, transient receptor potential channel polycystin-2.

