
Fig 9. circBHLF1 detection in reactivated Akata and Mutu I cells.
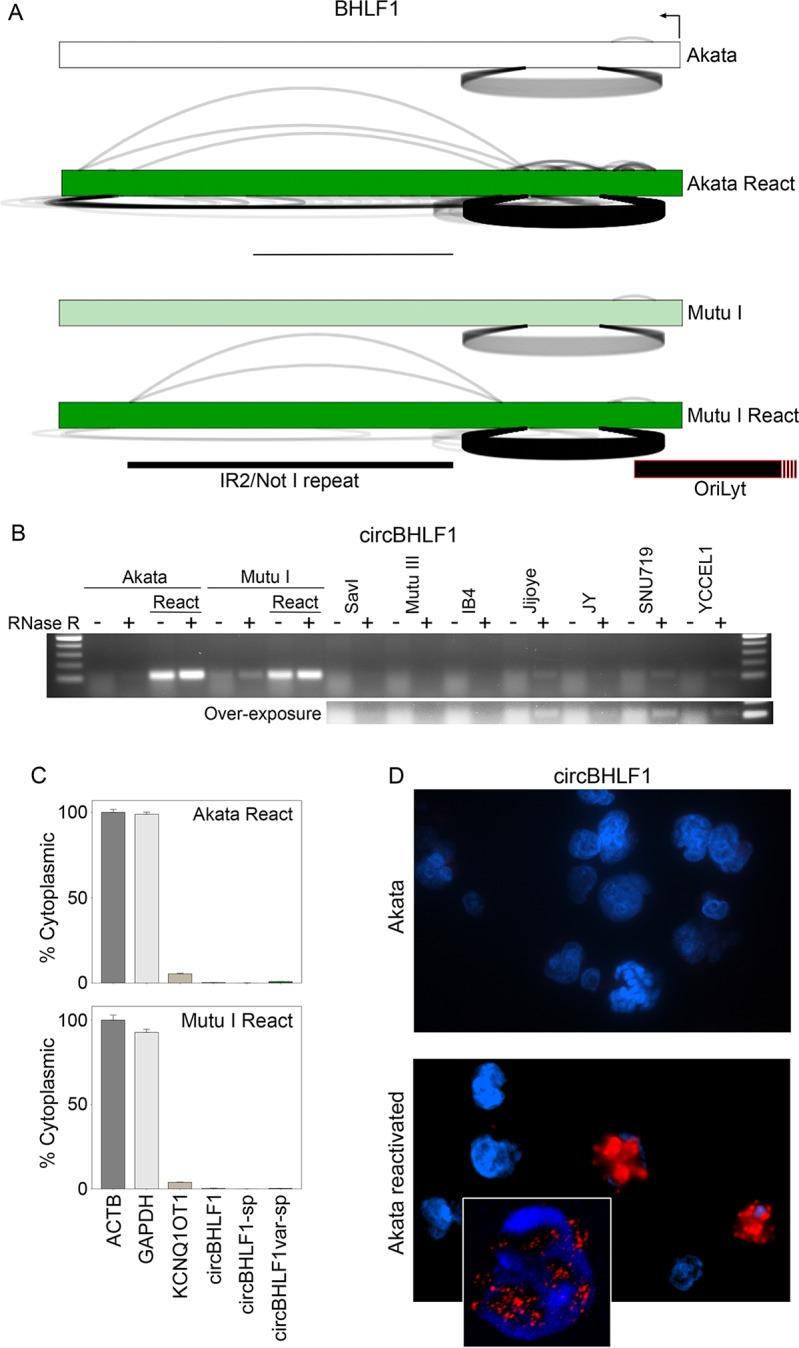
A) Backsplicing read counts (under arches) are derived from RNase R-seq datasets and forward splicing (over arches) and coverage data (exon color intensity) are derived from polyA-seq datasets. The number of arches (forward- and back-splicing) correspond to the number of junction spanning reads. Exon shading intensity reflects relative coverage levels across samples. B) RNase R-resistance of circBHLF1. All PCR reactions were repeated with similar results. C) Nuclear/cytoplasmic distribution of circBHLF1 using RT-qPCR. Cytoplasmically localized ACTB and nuclear localized KCNQ1OT1 are shown for comparison. Fraction cytoplasmic is relative to ACTB (cytoplasmic) and the most nuclear localized junction in the respective cell lines. Error bars represent standard deviations and were derived from triplicate qPCR reactions. These experiments were repeated once with similar results. Method for calculating fraction cytoplasmic is outlined in the methods section. D) BaseScope analysis of circBHLF1 cellular distribution. Inset shows confocal image of nuclear localization of circBHLF1.