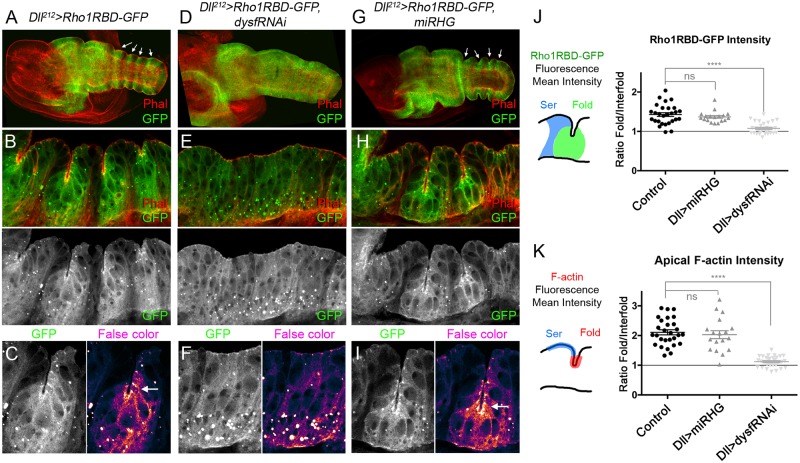
Fig 3. Rho1 activity pattern is altered in dysf loss of function.
(A-I) 3 hrs APF leg discs of the following genotypes: Dll212>Rho1RBD-GFP (A-C), Dll212>Rho1RBD-GFP, dysfRNAi (D-F) and Dll212>Rho1RBD-GFP, miRHG (G-I). Note that the striped pattern of Rho1 activity (arrows) is lost in D. Phal is in red and Rho1RBD-GFP in green. (B, E and H) Close up views of the distal leg epithelium (sagittal section) of the genotypes above. Regions of enhanced GFP levels are seen around the folds in B and H that are separated by regions of lower GFP levels in the interfold regions. This pattern is lost in E, where GFP levels remain homogeneous throughout the epithelium. Phal is in red and Rho1RBD-GFP in green and in separate channel below. (C, F and I) Magnification of a fold or putative fold region of the genotypes above, showing separate channel for GFP to the left and false color to enhance contrast to the right. GFP levels are accumulated apically in C and I in the cells that are undergoing apical constriction (arrow), while in F GFP is evenly distributed across the cells. (J and K) Ratio of fluorescence levels of Rho1RBD-GFP (mean intensity) (J) and apical F-actin (mean intensity) (K) within fold and interfold domains (Ser positive cells) for the previous genotypes (see also S2 Fig). In both cases, a ratio of 1 would imply the same levels in fold and interfold domains, while any increment over 1 means higher levels in the fold vs interfold domain. In control Dll212>Rho1RBD-GFP and Dll212>Rho1RBD-GFP, miRHG, the fold/interfold ratio for GFP and apical F-actin intensity is close to 1.5 and 2, respectively. However, when Dysf is knocked down, the fold/interfold ratio for GFP and apical F-actin intensity drops to close to 1. t2-t3 and t3-t4 folds were used for quantification (control n = 28 joints; miRHG n = 18 joints and dysfRNAi n = 30 joints for both measurements). ****p<0.0001, with Student’s t test, indicating a significant difference from control. ns, non-significant. Error bars represent SEM.

