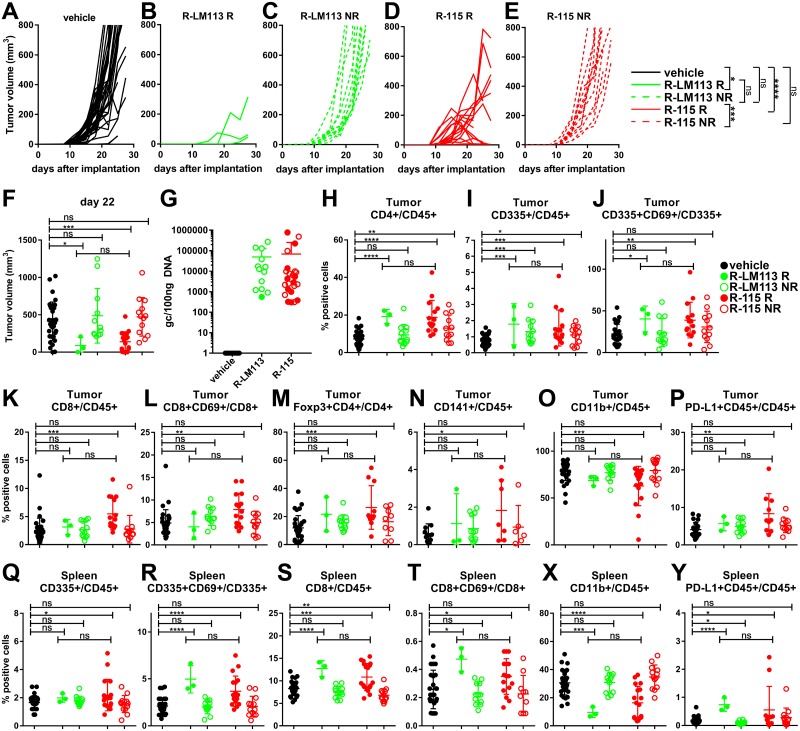
Fig 6. Short term intratumoral immune response and quantification of viral genome copy numbers.
A new group of mice treated with R-LM113 or R-115 from d 10 after tumor implantation (same treatment schedule as in Fig 4A), was sacrificed 6–7 days after completion of the virus treatment. (A-E) Kinetics of tumor growth for mice treated with vehicle (A), R-LM113 (B, C) or R-115 (D, E). Pooled results from 3 experiments. The virus-treated mice were subdivided in responders (R) and non-responders (NR). The responders showed a regression or slowdown in tumor growth, measured as a reduction in the tumor volume in at least one of the last two measurements before sacrifice (d 2 and d 5 after the last treatment) or increments of the tumor sizes smaller than 50% in the last two measurements. The non responders exhibited a tumor growth similar to that in the vehicle-treated arm. R-LM113 responders (B) and non responders (C). R-115 responders (D) and non responders (E). Statistical significance was calculated using the RM (repeated measures) two way ANOVA-test until d 25. (F) Tumor volumes at d 22. In this and subsequent panels, Black circles, vehicle-treated mice (vehicle). Full green circles, R-LM113 responder mice (R-LM113 R). Open green circles, R-LM113 non-responder mice (R-LM113 NR). Full red circles, R-115 responder mice (R-115 R). Open red circles, R-115 non-responder mice (R-115 NR). (G) Viral genome copy number in tumors, relative to a standard curve prepared by means of purified HSV DNA. Results are expressed as gc/100ng of DNA. (H-O) Tumor infiltrating cells. (Q-X) Splenocytes. (P, Y) PD-L1 expression by CD45+ cell in tumors (P) and in spleens (Y). (F, H-Y) Statistical significance was calculated using the t-test.

