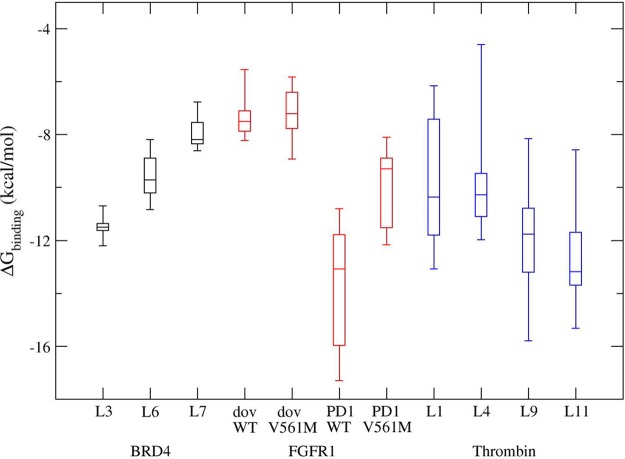
Figure 4.
Box plots of calculated absolute binding free energies for ligand binding to BRD4 (black), FGFR1 (red), and thrombin (blue). The binding free energies are generated by combining results from all steps in the thermodynamic cycle (Figure 2); there are 500 possible combinations from the replicas used in the three simulation steps. The graph displays the distribution of data based on the five number summary: minimum, first quartile, median, third quartile, and maximum. The central rectangles span the first quartile to the third quartile: the interquartile range.

