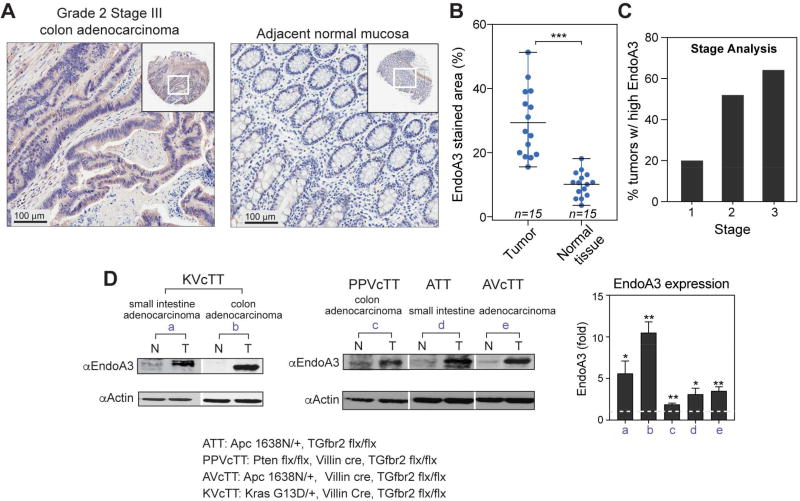
Figure 1. EndoA3 is upregulated in aggressive colon cancers.
(A) Representative images for immunohistochemistry staining of human colon tissue microarrays (US Biomax). Images are shown for a tumor (grade 2, stage iii) (left) and normal mucosa (right) from the same patient. EndoA3 was visualized using rabbit polyclonal antibody against human EndoA3 (Abcam). Specificity of EndoA3 antibody for IHC was determined as described in Materials and Methods. In addition, control IgG showed no staining on human adrenal gland samples (Supplementary Figure 1A). (B) The average levels of EndoA3 in cancers and normal tissues from multiple patients were compared using an image deconvolution algorithm in ImageJ. The size of areas with positive EndoA3 staining was normalized to the size of total tissue area (Ruifrok and Johnston, 2001) (*** p<0.001, n = number of patient samples). (C) The ‘H’ score system (Metz et al., 2016) was used in stage analysis of EndoA3 expression. The percentage of tumors with higher H scores than normal neighboring tissues was plotted based on the tumor stage (stages 1-3). (D) Immunoblotting for EndoA3 in mice colon tumor sets (a-e). Normal mucosae (N) and adenocarcinoma tumors (T) were analyzed. EndoA3 levels were normalized to actin, and the fold changes were indicated below the EndoA3 blots (left and middle panels). Genotypes of the mouse models were listed at the bottom of the panel. EndoA3 expression levels in each sample set (a-e) that includes a tumor tissue and its neighboring normal mucosae were quantified using densitometry (3 sample sets were analyzed for each data point). Paired Student’s t-test was used for statistical analysis. ** p<0.01, * p<0.05. Fold changes of EndoA3 levels in tumors were plotted in the right panel. The dashed line indicates the expression level of EndoA3 in normal mucosae.

