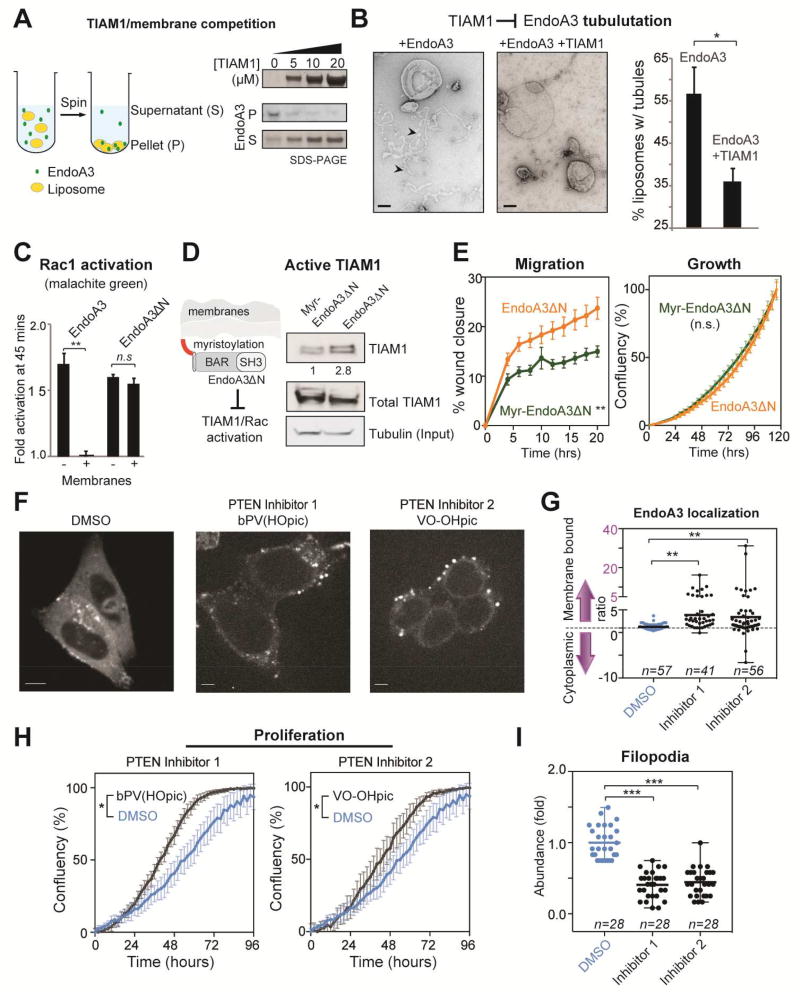
Figure 6. TIAM1 and membranes compete for EndoA3.
(A) Addition of recombinant TIAM1 fragments reduces membrane bound EndoA3 BAR. Cosedimentation assays were used to detect membrane-bound (pellet, P) and unbound (supernatant, S) fractions of EndoA3. Liposomes (1%PIP2, 24%PS, 70%PC, 5%NBD-PE, 0.5mM total lipids) and his6-tagged EndoA3 BAR domain (2 µM) were incubated with TIAM1 (0, 5, 10, and 20 µM, respectively) for 30 minutes. Samples were centrifuged at 75,000 rpm for 30 min. Supernatants and pellets were analyzed by western blotting and enhanced chemiluminescence. (B) Addition of TIAM1 reduces the tubulation activity of EndoA3. Liposomes (1%PIP2, 24%PS, 75%PC, 0.5mM total lipids) were incubated with his6-tagged EndoA3 BAR (1µM), with and without the recombinant TIAM1 fragment (20 µM), for 30 min at room temperature. Samples were analyzed using negative stain transmission electron microscopy. Representative images were shown at the left. The fraction of liposomes with membrane tubules were quantified and shown at the right. Unpaired Student’s t-tests were used for statistical analysis of 3 independent experiments. * p<0.05. (C) Membrane inhibits EndoA3-dependent, but not EndoA3ΔN-dependent, Rac1 activation. His6-tagged EndoA3 BAR (WT or ΔN; 8 µM) and TIAM1 fragments (0.5 µM) were incubated with Rac1 (2µM) in the absence and presence of liposomes (1%PIP2, 25%PS, 74%PC, 0.5mM total lipids). Fold activation of Rac1 GTPase activity was calculated using results from control experiments in the absence of his6-tagged EndoA3 BAR. Malachite green assay was used to quantify free phosphate groups released from GTP by Rac1. Student’s t-tests (** indicates p<0.01). (D) Anchoring EndoA3ΔN to the plasma membrane using an N-myristoylation tag reduces the levels of active TIAM1 in DLD1 cells. Lysates from DLD1 cells expressing EndoA3ΔN-GFP and Myr-EndoA3ΔN-GFP were analyzed. Active TIAM1 was detected using Rac1 G15A agarose beads. TIAM1 signal was normalized to tubulin levels. The ratio of active TIAM1 levels between EndoA3ΔN-GFP and Myr- EndoA3ΔN-GFP cells were indicated. (E) The ability of EndoA3ΔN to stimulate cell migration is significantly reduced when it is anchored to the plasma membrane. Migration (left) and growth (right) of DLD1 cells expressing either myr-EndoA3ΔN-GFP (green) or EndoA3ΔN-GFP (orange) was quantified using the automated assays described in Figure 2. Error bars indicate SEM. Statistical analysis was done using two-way ANOVA (** p<0.001). (F) EndoA3 localization was examined using fluorescence microscopy. EndoA3 cells were treated with DMSO (left), PTEN inhibitor 1 (bpV(HOpic), 200nM; middle), or PTEN inhibitor 2 (VO-OHpic, 200nM; right). (G) Ratio between membrane-bound and cytoplasmic EndoA3 was measured using ImageJ as previously described in Materials and Methods. “n” = the number of cells analyzed. ** p<0.01, one-way ANOVA. (H) Inhibition of PTEN accelerates the growth of EndoA3 DLD1 cells (4 independent experiments, * p<0.05). (I) Inhibition of PTEN reduces filopodia abundance in EndoA3 DLD1 cells (“n” = number of images analyzed). Three independent repeats. *** p<0.001, one-way ANOVA).

