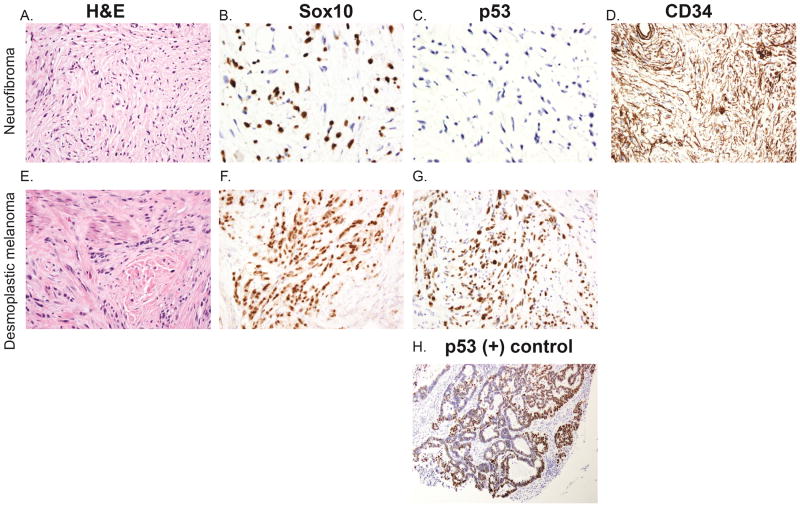
Figure 1.
H&E of desmoplastic melanoma (A) and neurofibroma (E) at 200x magnification. p53 and SOX-10 staining of desmoplastic melanomas x 200x magnification (F,G) and neurofibromas at 400x magnification (B,C). Desmoplastic melanomas demonstrate strong positive p53 staining (G) while neurofibromas remain negative (C). In contrast, SOX-10 staining is comparable in desmoplastic melanoma (F) and neurofibroma (B). Neurofibromas also demonstrate CD34 fingerprinting pattern, 200x magnification (D). Positive control of p53 staining (H).

