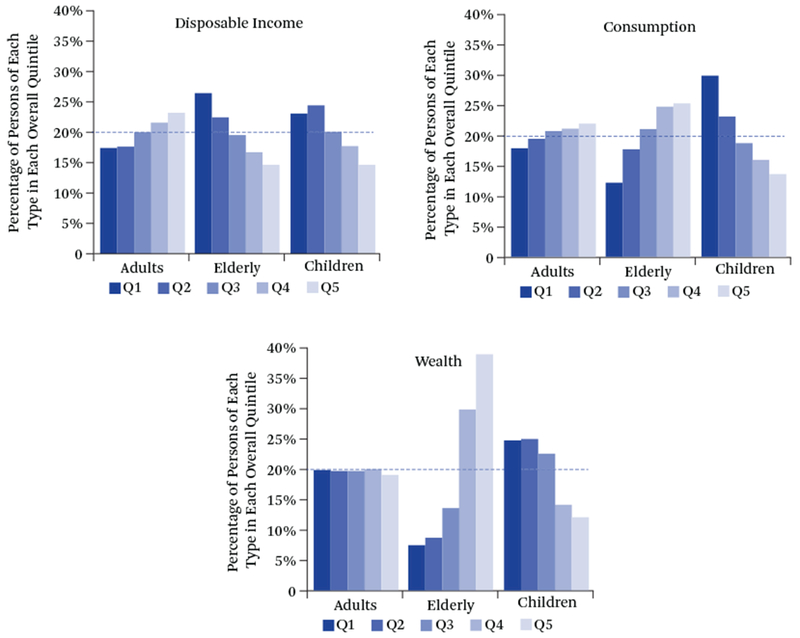
Figure 2.

Demography of Inequality by Age, 2010
Source: Fisher et al. 2015.
Note: The data are for number of persons by age: children (under age eighteen); elders (age sixty-five and over), so person weighted. Overall inequality is not shown, but if so, it would be at 20 percent of the population overall in each quintile. Each quintile is ranked by its own measure (income, consumption, or wealth) with an equivalence scale adjustment using the square root of household size. Adults include those currently living with elders or children under age eighteen, as well as childless adults.
