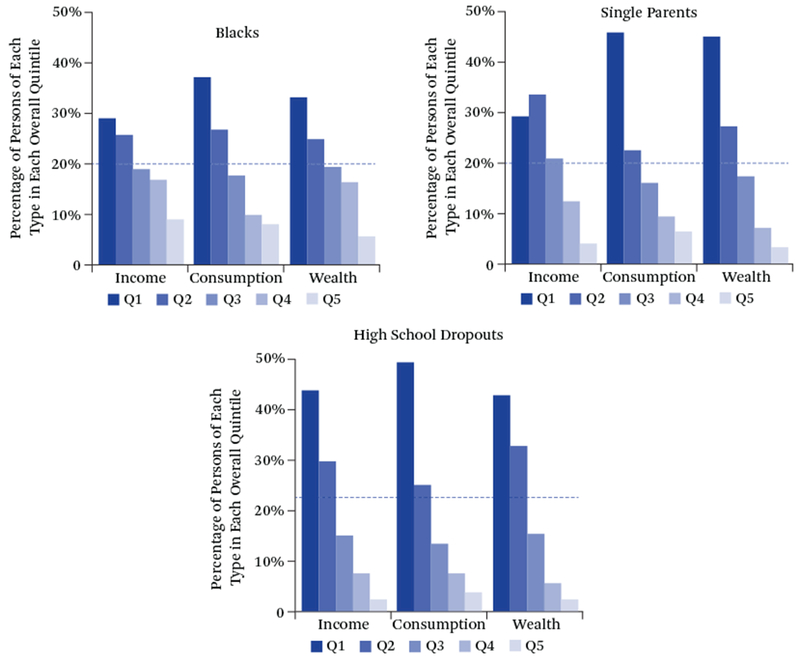
Figure 3.

Vulnerable Groups in 2010
Source: Fisher et al. 2015.
Note: The data are for number of persons by race, all blacks; all children and adults who are single parents with children under age eighteen; and all adults (age twenty-one and over) who did not finish high school. Each quintile is ranked by its own measure (income, consumption, or wealth) for the whole population with an equivalence scale adjustment using the square root of household size. Hence, the figure shows where each group is located in the overall distributions of income, consumption, and wealth.
