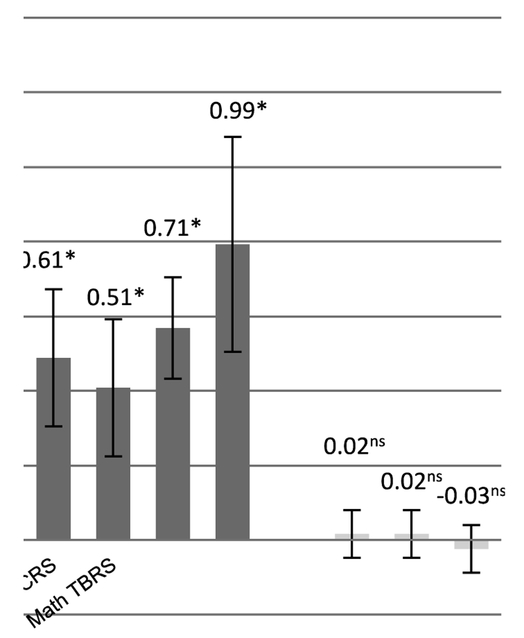
Figure 5.
classroom and child Impacts of comparision IV:Creative Curriculum vs. Locally-Developed Notes: Bars show estimated impacts of various curricula comparisons on classroom process quality and child outcomes as measured by composite standardized scores of literacy skills, math skills and socioemotional skills. Each figure is from one of the curricula comparisons described in Figure 1, and each bar is from a separate regression. Standard error bars are shown for each estimate. *p<.05.

