
Figure 1.
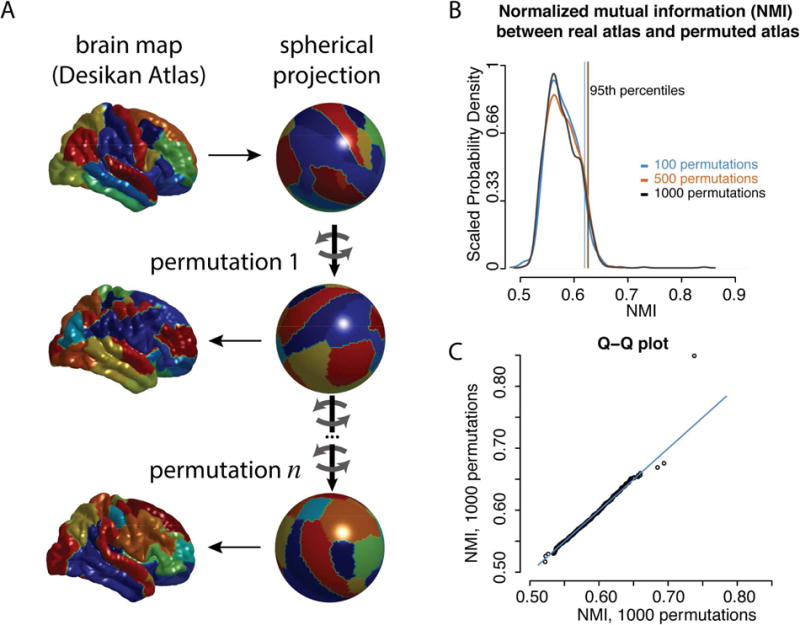
A schematic of the permutation procedure. A) As an illustration, the Desikan atlas is shown in the original space (top left) and spherical space (top right). Each color corresponds to different regions. The spherical coordinates are rotated (mid right, bottom right) and the projected back onto the anatomical surface (mid left, bottom left). B) The degree of similarity between the original parcellation and the rotated parcellations were estimated using the normalized mutual information (NMI). The probability density distributions of this statistic are shown for 100, 500, and 1000 rotations, as well as lines marking the 95th percentile of each distribution. C) A Q-Q plot of the two independent distributions of 1000 rotations each.