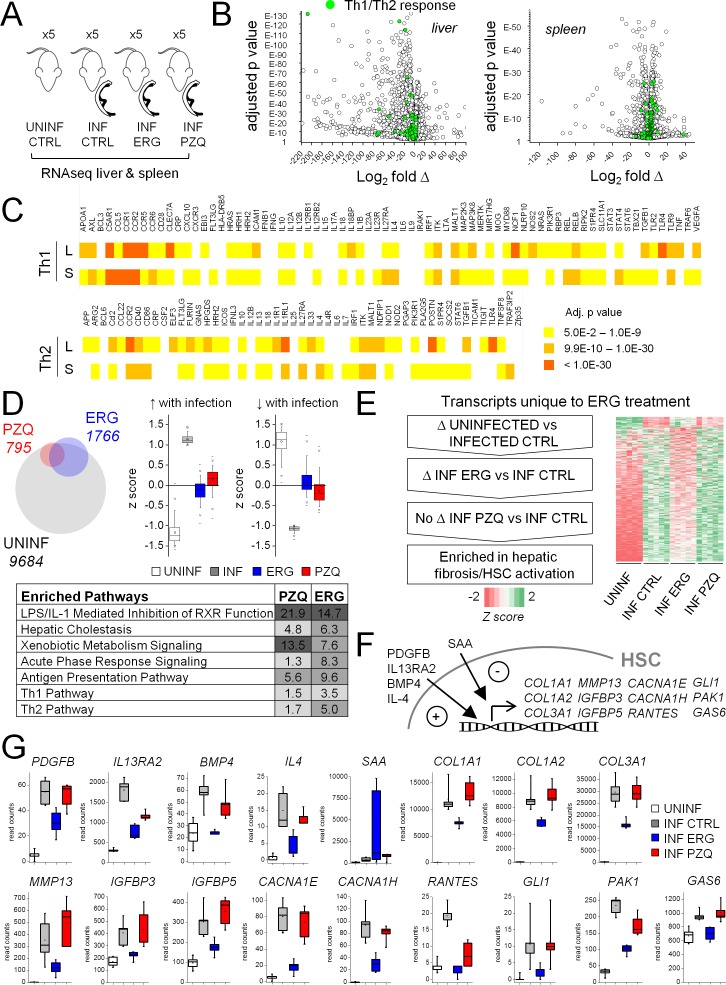
Figure 7. Effect of ergotamine on immune response and hepatic stellate cell activation.
(A) Schematic of schistosome infection and drug treatment cohorts analyzed. Livers and spleens were harvested from infected mice treated with vehicle control, ergotamine (ERG 60 mg/kg, twice daily for 7 days) or praziquantel (PZQ 50 mg/kg, once daily for 5 days), as well as uninfected littermate controls. Five mice were used per cohort. (B) Volcano plots showing transcriptional changes of the liver and spleens from infected mice compared to uninfected littermates. Green shading highlights gene products involved in Th1/Th2 cell signaling. (C) Heat map of liver (L) and spleen (S) changes in Th1 and Th2 signaling pathways - color intensity corresponds to significance (FDR adjusted p-values). (D–G) Effects of anthelmintics on hepatic gene expression of schistosome infected mice. (D) Top left - differentially expressed transcripts comparing the livers of infected controls to uninfected littermates (grey), PZQ-treated animals (red) and ERG-treated animals (blue). Top right - expression of transcripts either up-regulated or down-regulated in infected livers relative to uninfected livers (z score ≥1 or ≤−1) in control and drug treated animals. Bottom, transcripts differentially expressed between PZQ-treated or ERG-treated and control infections represent pathways involved in liver function, drug metabolism and immune response. Ingenuity Pathway Analysis enrichment scores reflect -log10 p-value of PZQ and ERG datasets (p-value 0.05 = -log10 1.3). (E) Filtering of transcripts changing with schistosomiasis infection that are affected by ERG but not PZQ, resulting in an enrichment for gene products involved in hepatic fibrosis/HSC activation. (F) Role of various gene products in HSC activation, and (G) read counts for these transcripts across uninfected (open box), infected (grey box) and ERG-treated (blue box) and PZQ-treated (red box) cohorts. Box plots represent 25–75 percentile, whiskers 5–95 percentile. Inset; bar = median, square = mean. Read count data for liver and spleen samples available in Supplementary files 2 and 3.

