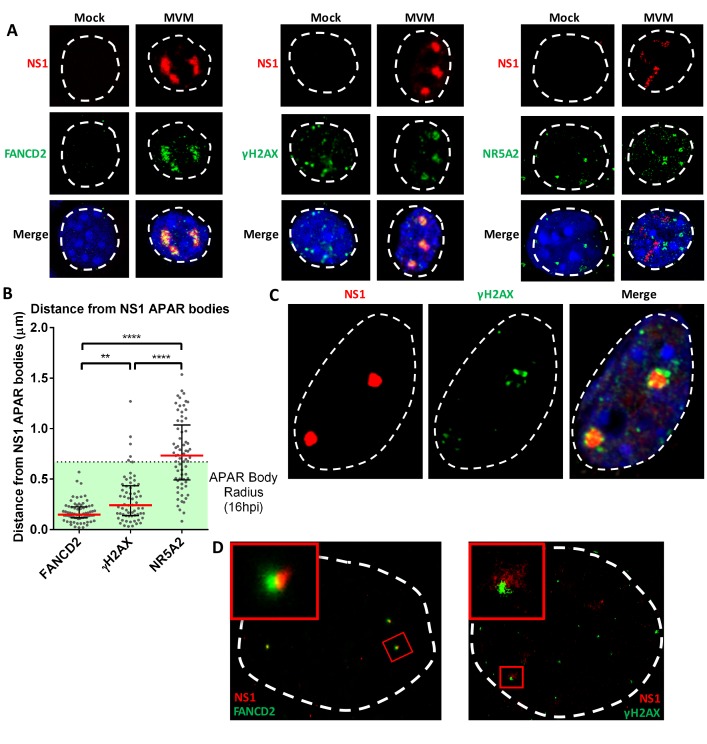
Figure 1. The replicating MVM genome associates with cellular sites undergoing DNA damage.
(A) Representative confocal images of Mock versus MVM infected murine A9 cells at 16 hpi, probing MVM-NS1 (red) and the DDR factors FANCD2 and γ-H2AX, and the irrelevant transcription factor NR5A2 (green), quantified in (B). Blue corresponds to DAPI staining. Nuclear border is indicated by dashed white line. (B) The distances between NS1 and indicated DDR proteins were calculated from deconvolved confocal z-stacks using Huygens and ImageJ programs (described in Materials and methods), and the non-associated transcription factor NR5A2 was used as a negative control. Results are represented as grey scatterplots from three independent infections, with the median value of the dataset depicted by a red line. Black error bars represent the interquartile range of the dataset. The radius of APAR bodies were calculated by measuring the diameter of APAR bodies from multiple fields from three independent infections at 16 hpi imaged using confocal microscopy and deconvolved using Huygens software. The radius of APAR body was calculated by dividing the median diameter by 2, and is represented as a dashed horizontal line. Significant differences are denoted as *p<0.05, **p<0.005 and ****p<0.0005 (one-way ANOVA, multiple comparisons). (C) Representative image of an APAR body at 16 hpi imaged using a super-resolution Airyscan imaging platform, where NS1 (red) stains the APAR body and γ-H2AX (green) stains for DNA damage. DAPI stains the nuclear border, demarcated by a white dashed line. (D) Super-resolution GSD-STORM imaging of MVM-APAR bodies at 16 hpi and cellular DDR markers, including FANCD2 (left) and γ-H2AX (right). The nuclear borders are demarcated by a dashed white line and were identified by brightfield imaging (not shown). The inset shows magnifications of the APAR bodies (red) and the respective DDR protein (green).

