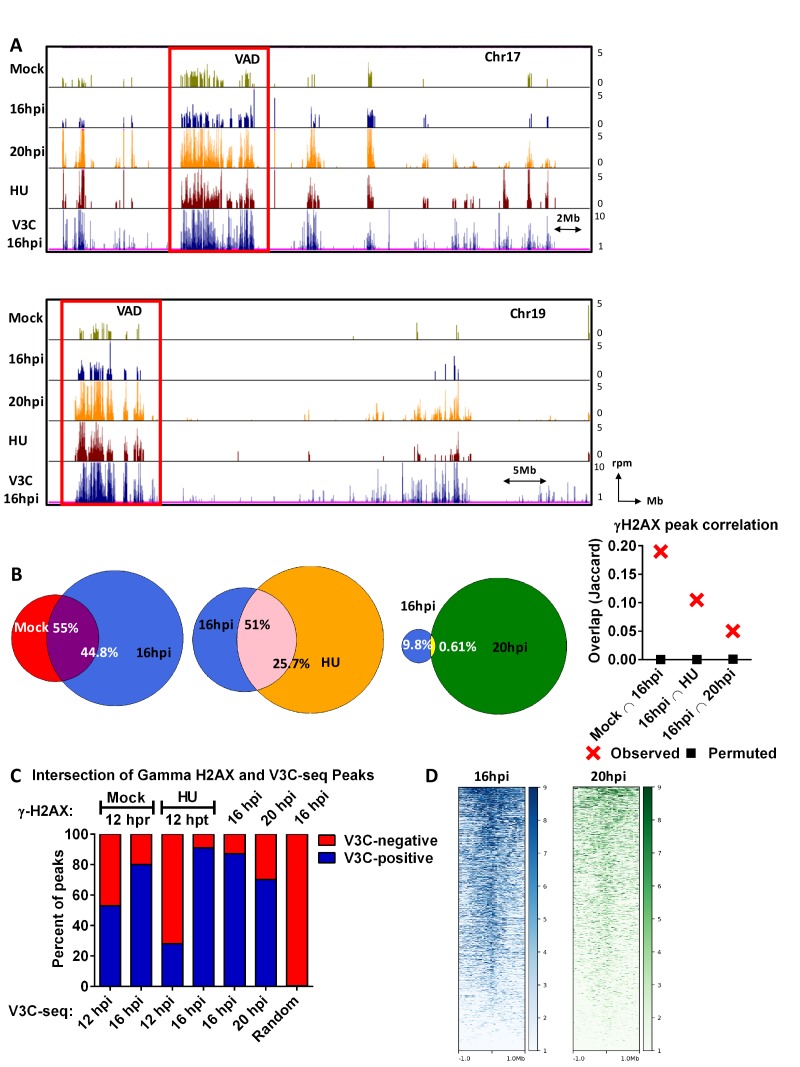
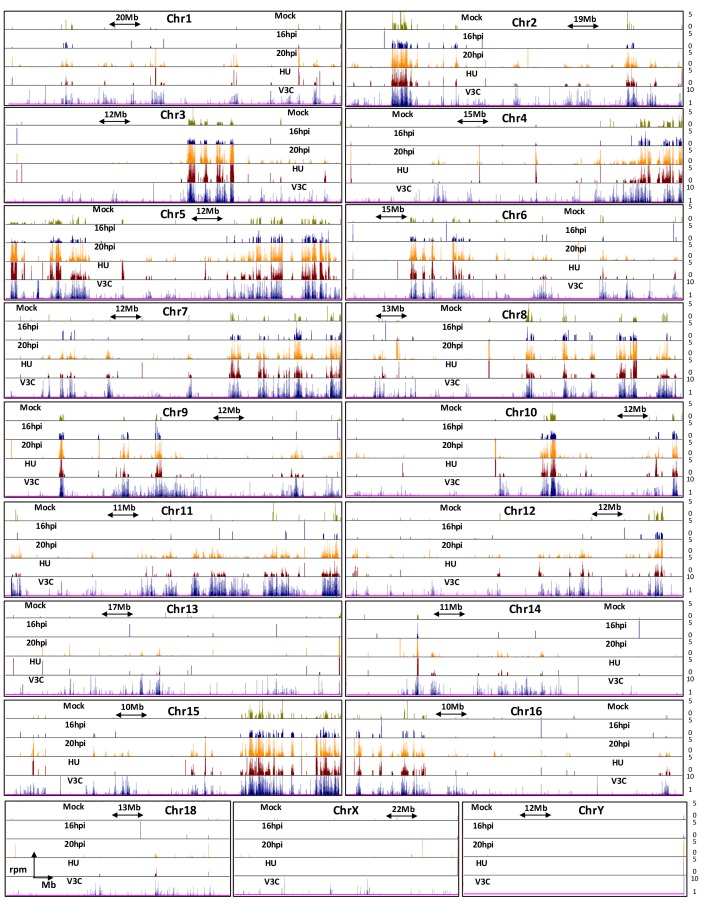
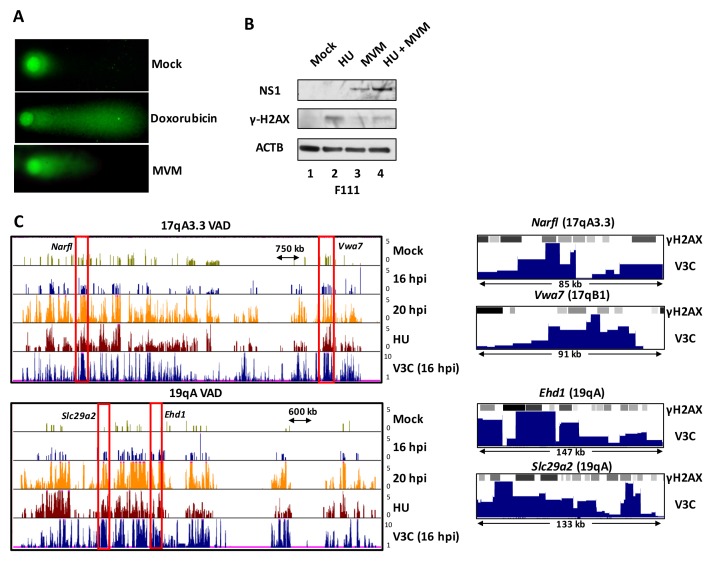
Figure 3. The MVM genome initiated infection at sites of cellular DNA damage that in mock infected cells also exhibited DNA damage as the cells cycled through S-phase, and as infection progressed, localized to additional sites of induced damage.
(A) Representative quantile normalized ChIP-seq plots of γ-H2AX binding to the cellular genome on Chromosome 17 (top) and Chromosome (19). The tracks represent γ-H2AX ChIP-seq peaks in A9 cells that are mock infected at 12 hr post release (green), MVM infected at 16 hpi (blue), 20 hpi (yellow), and HU treated A9 cells 12 hr (maroon). V3C-seq peaks at 16 hpi are also shown at the bottom for comparison (blue). Red rectangle denotes VAD sites, and y-axis values for ChIP-seq peaks have been restricted from 0 to 5 reads per million. (B) The EPIC-called ChIP-seq peaks at different timepoints for MVM infection were analyzed for coincident γ-H2AX binding using BEDTools (Quinlan and Hall, 2010), and the resulting distances covered on the genome were plotted on Venn Diagrams as percentage of total coverage. Statistical significance of the overlap was determined using Jaccard analysis on BEDtools (far right, red crosses), with a control comparison permuted by determining the extent of overlap with a randomly generated peak file with domains of equivalent size as ChIP-seq peaks (represented as black squares). (C) γ-H2AX peaks from ChIP-seq experiments were intersected with VAD peaks identified in Figure 1C for the corresponding timepoints (Mock γ-H2AX was intersected with 12 hpi). The percentage of total regions that coincided were calculated and plotted for VAD-associated γ-H2AX peaks (designated as ‘V3C-positive’), and γ-H2AX associated VAD-peaks. (D) Heatmap of MVM association with DNA damaged sites were generated using DeepTools on the Galaxy server (Afgan et al., 2016; Ramírez et al., 2016). The average V3C enrichment on 1 Megabase around γ-H2AX positive sites were determined and plotted as shown.


