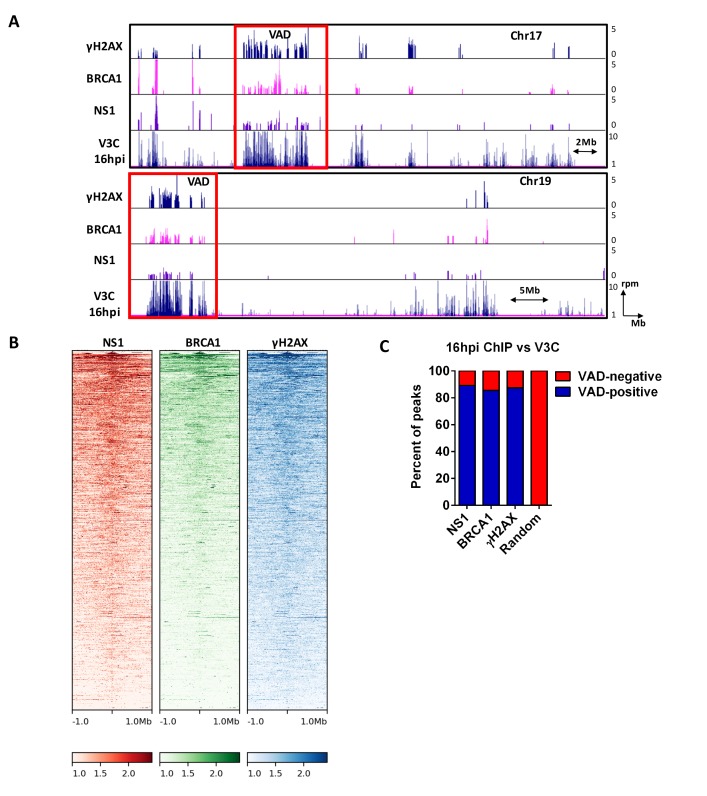
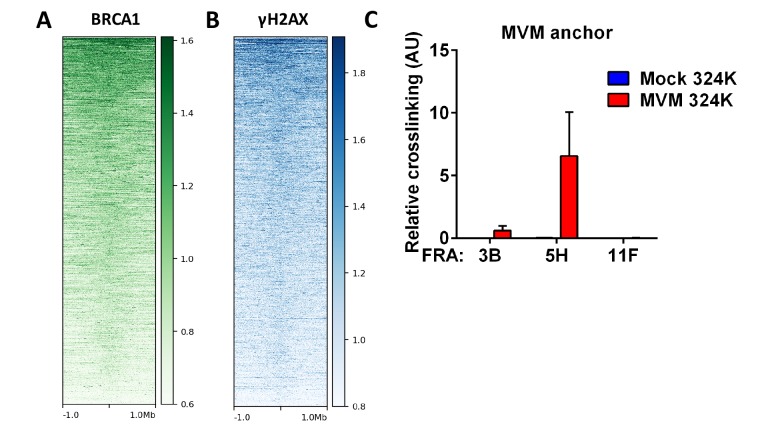
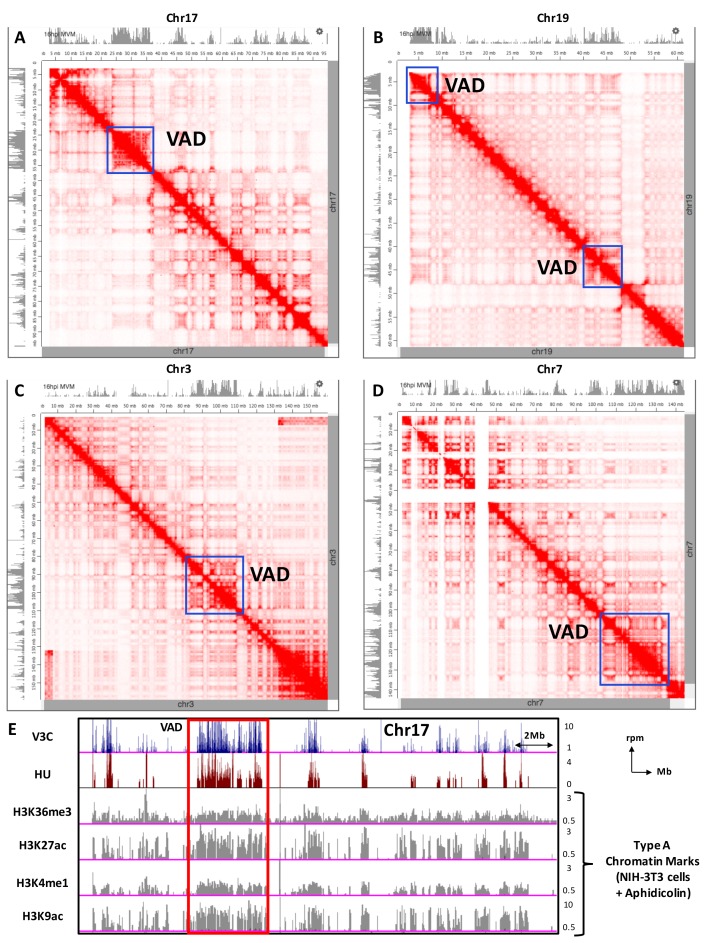
Figure 4. MVM NS1 colocalizes to sites of cellular DNA damage along with MVM genome.
(A) Representative quantile normalized ChIP-seq plots of MVM-NS1 (purple) and BRCA1 (pink) binding to the cellular genome on Chromosome 17 (top) and Chromosome 19 (bottom), with γ-H2AX and V3C at 16 hpi. Red rectangle denotes VAD sites, and y-axis values for ChIP-seq peaks have been restricted from 0 to 5 reads per million. (B) The enrichment of NS1 (left), BRCA1 (middle) and γ-H2AX (right) around MVM-associated regions were calculated and plotted as heatmaps using DeepTools on the Galaxy server (Ramírez et al., 2016). (C) The fraction of NS1 and DDR-positive genomic regions that colocalized with V3C at 16 hpi were calculated using BEDTools, and presented as VAD-positive sites. A library of randomly generated ChIP-seq peaks on the mouse genome with the same fragment size as the called peaks was used as control and also intersected with the MVM-VADs.


