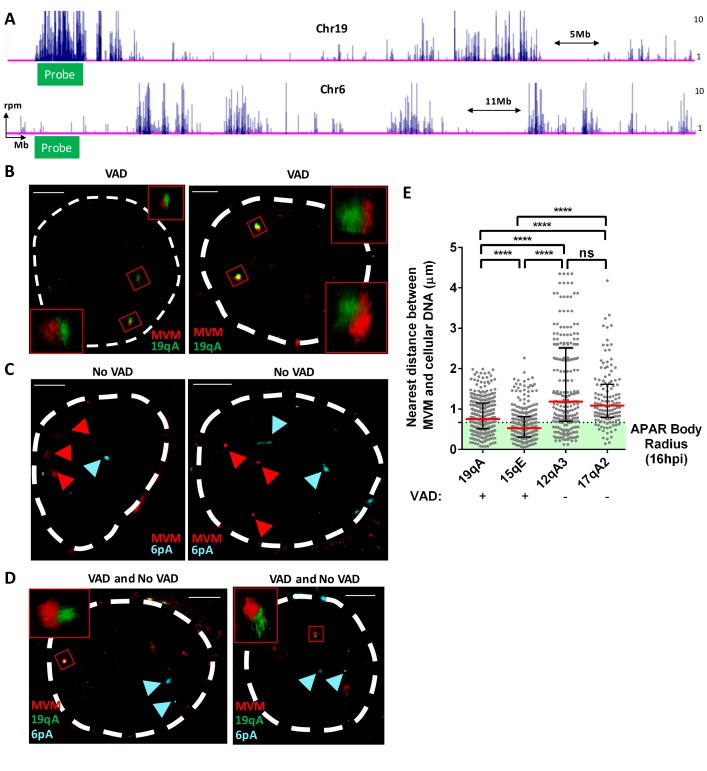
Figure 5. FISH assays confirmed that MVM localized with cellular sites of DNA damage.
(A) Schematic of Chromosomes 19 and 6 showing where MVM associates with the mouse genome in A9 cells at 16 hr post infection, depicting the sites where FISH probes were designed. Representative GSD-STORM images show the spatial localization of the MVM genome (red) with (B) chromosome 19 VAD (19qA, green), (C) chromosome 6 control site (6 pA, cyan), and (D) both probe sets. (B) The MVM probe is labelled in red, while the cellular VAD site at 19qA is labelled in green. The insets show magnified views of the MVM-VAD probe sets demarcated by red rectangles in the original image. (C) The MVM probe is labelled in red and cellular site associated with non-VAD at 6 pA (shown in 5A, bottom) is labelled in cyan. Red arrowheads indicate the location of the MVM probes, and the cyan arrowhead indicates the location of the 6 pA region of the cellular genome. (D) Relative locations of the MVM genome with cellular VAD-associated site at 19qA (green) and non-VAD site at 6 pA (cyan) in the same cell. The inset shows a magnified view of the MVM-VAD probe set, and cyan arrows indicate the non-VAD-associated probes. Nuclear borders are labelled in white dotted line. Scale is presented as a white line and measures 2 μm. (E) The absolute distance between MVM and cellular genome at sites identified as VADs (19qA and 15qE) versus VAD-negative sites (12qA3 and 17qA2) were calculated using 3D-FISH. Results are depicted as grey dots for each individual APAR body in multiple fields from least three independent infections of parasynchronized A9 cells at 16 hpi, with the median distance represented by a red line. Black error bars represent the interquartile range of the dataset. The median radius of an APAR body at 16 hpi is shown as a dashed horizontal line, and teal shading indicates the domain which would be occupied by the APAR body. Significant differences are denoted as ****p<0.0005 (one-way ANOVA, multiple comparisons). ns designates non-significant statistical differences between datasets.

