Fig. 2.

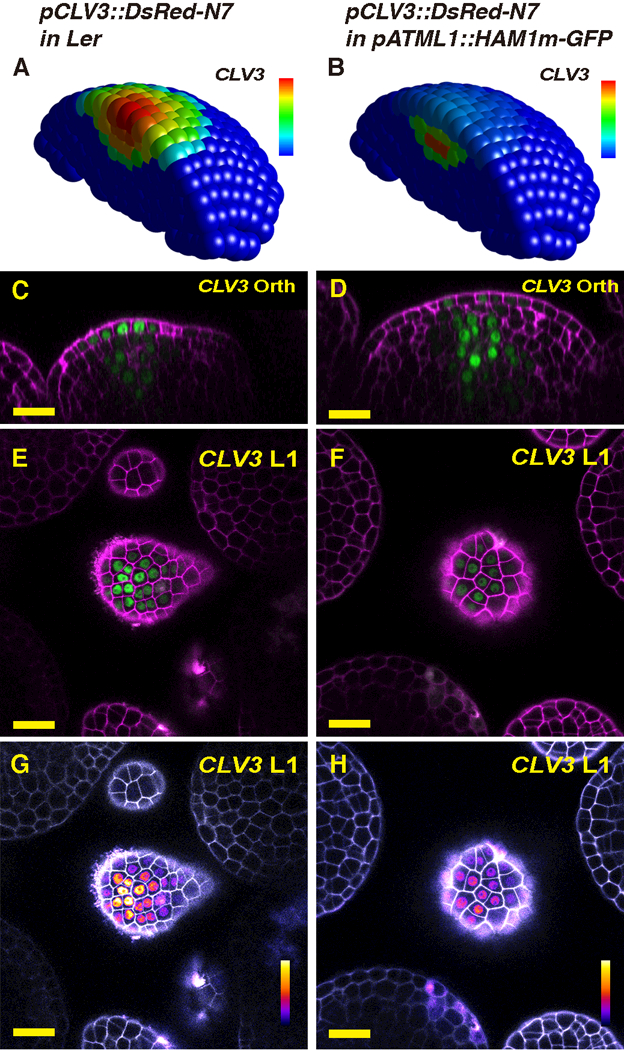
Results of HAM expression changes in the L1. (A-B) The simulated CLV3 expression domain in 3D in both wild type (A) and the pATML1::HAM1m-GFP transgenic plant (B) in which HAM1 is over-expressed in the epidermis. The CLV3 mRNA levels are indicated by color, with a gradient from red (maximum, 0.86 arbitrary units, a.u.) to blue (0). (C-H) Validation of the computational simulation through confocal live-imaging of a pCLV3::DsRed-N7 (green) reporter in a pATML1::HAM1m-GFP transgenic plant. Orthogonal (C-D) and transverse section (E-H) views of the same wild type (Ler) plant (C, E, G) or the same L1-HAM transgenic plant (D, F, H) are shown. PI counterstain is represented in purple (C-F) or gray (G-H), and the relative pCLV3::DsRed-N7 signal intensity is indicated by color (G-H). Scale bar: 20 μm; color bar (G-H): fire quantification of signal intensity. Here and elsewhere in this report, the whole SAM template was used for all of the simulations, but only a half of the SAM is represented, for visualization of cells in inner layers.
