Fig. 4.

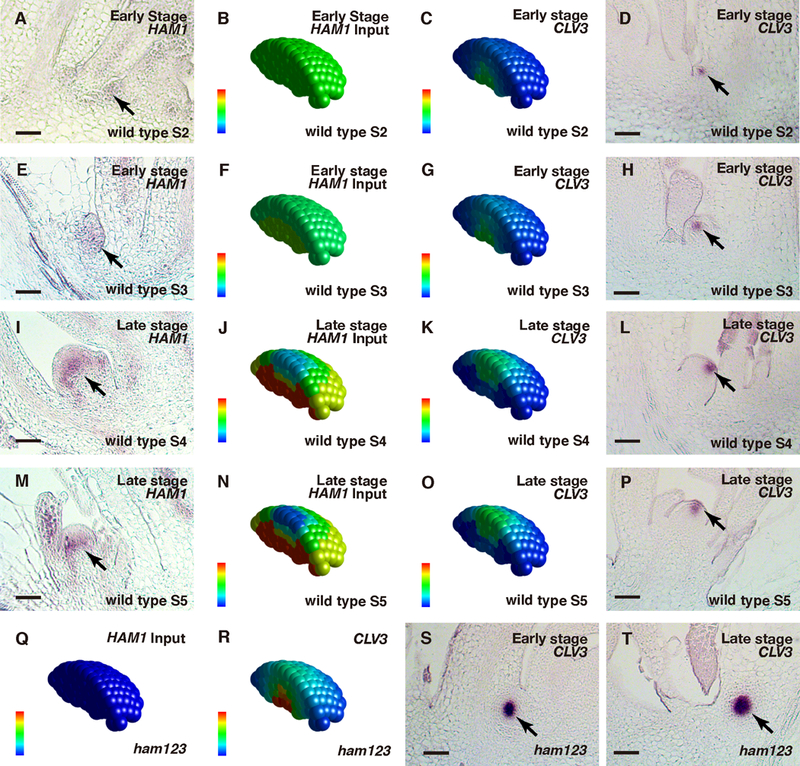
Patterning during the de novo formation of axillary stem cell niches in wild type (A-P) and in ham1;2;3 (Q-T). (A, E, I, M) In situ hybridization to HAM1 RNA in wild type, at early (A, E) and late (I, M) stages of axillary meristem (AM) initiation. (B, F, J, N) Levels of HAM concentration in wild-type at early (B, F) and late stages (J, N) as input. (C, G, K, O) Simulated CLV3 mRNA levels at early (C, G) and late stages (K, O) in wild type. (D, H, L, P) Validation of the simulation through the in situ hybridization to CLV3 mRNA in a wild type AM at early (D, H) and late stages (L, P). (Q) HAM concentration was set at zero in ham1;2;3 at all stages as the input. (R) Simulated CLV3 mRNA levels at different developmental stages in ham1;2;3. (S-T) Validation of the simulation through RNA in situ hybridization of ham1;2;3 AMs. The initiation of AMs in ham1;2;3 was disturbed, and did not follow the well-characterized developmental stages (23–24). The early (S) and late (T) stages of AM initiation in ham1;2;3 were defined based on the distance of leaf axils from the same main SAM in longitudinal sections. In each individual cell, the relative HAM protein level (input) is indicated by color (blue: 0, red: maximal level 1), and the relative CLV3 mRNA level (output) is also indicated by color (blue: 0, red: 1.23 a.u). Arrows: HAM1-expressing cells (A, E, I, M) and CLV3-expressing cells (D, H, L, P, S-T) during new meristem initiation. Scale bar: 50 μm.
