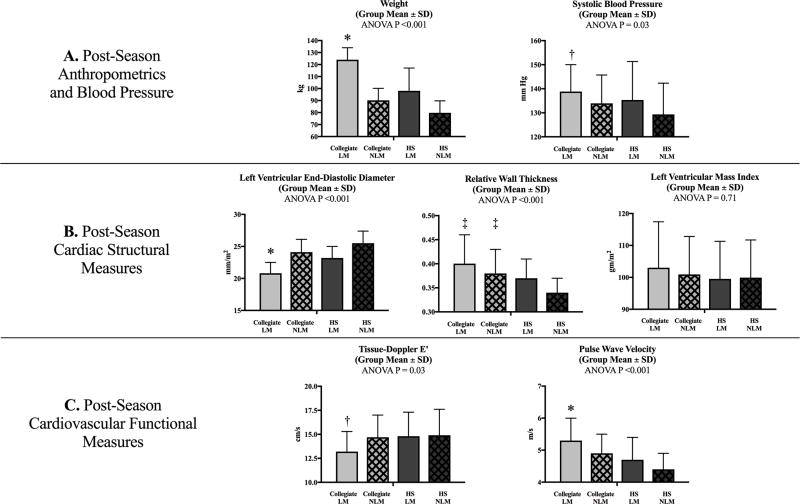
Figure 1.
Comparison of collegiate and high school American-style football participants stratified by player position, LM and NLM
One-way ANOVA comparison of post-season weight and systolic blood pressure (row A), cardiac structural measures (row B), and cardiovascular functional measures (row C) by player position (Collegiate LM, Collegiate NLM, HS LM, and HS NLM).
HS: high school; LM: linemen; NLM: non-linemen
* Adjusted P <0.001 (Bonferroni correction) collegiate LM versus all other groups
† Adjusted P <0.05 (Bonferroni correction) collegiate LM versus HS NLM
‡ Adjusted P <0.05 (Bonferroni correction) collegiate LM and collegiate NLM versus HS NLM

