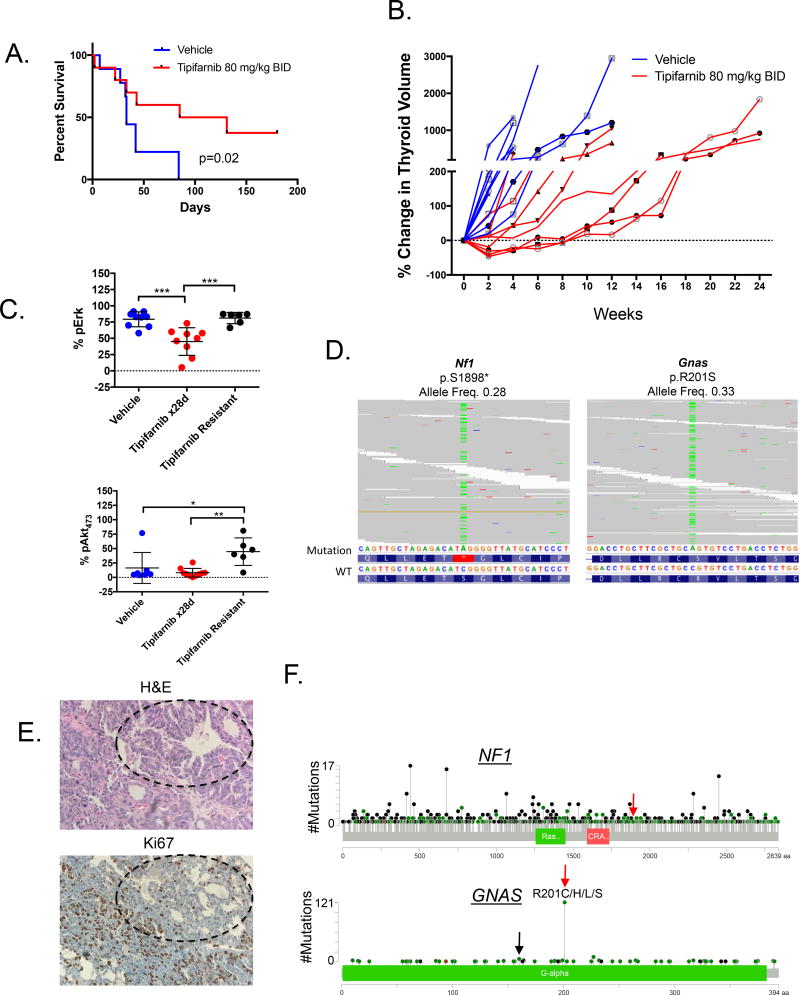
Figure 4. Nf1 and Gnas mutations in tipifarnib-resistant Hras;p53 tumors.
A. Tipifarnib (n=9) prolongs survival of tumor-bearing Hras;p53 mice compared to vehicle (n=10) (log-rank p=0.02). B. A time course of thyroid volume changes (as measured by ultrasound) in tumor-bearing Hras;p53 mice treated with vehicle (n=10) or tipifarnib 80 mg/kg BID (n=9). C. Increased Erk (top) and S473-Akt (bottom) phosphorylation in vehicle (n=10) and tipifarnib-treated tumors (28 days, n=9) and tipifarnib-resistant tumors (n=6) (*p<0.05, **p<0.01, ***p<0.001, Mann-Whitney test) as measured by color threshold analysis of IHC-stained tumor sections. D. BAM files from whole exome sequencing of two Hras;p53 PDTCs, one with a truncating Nf1 mutation in exon 39 (left) and one with activating R201S mutation in Gnas (right). E. H&E and Ki67 of the tipifarnib resistant mouse tumor with the GnasR201S mutation (20×). Well-differentiated components with lower Ki67 staining (black circles) are identified in proximity to the poorly differentiated elements. F. Pan-cancer spectrum of NF1 and GNAS mutations in an institutional clinical cohort undergoing targeted exome sequencing with the MSK-IMPACT panel (55). Red arrows indicate amino acid changes observed in resistant Hras;p53 tumors. GNASR201 mutations are the most common. GNASR160 substitutions are also observed in human tumors (black arrow).

