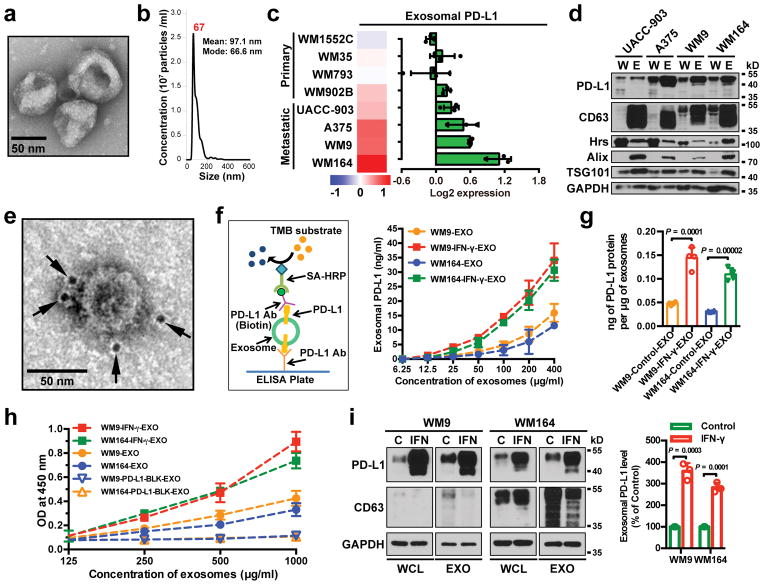
Figure 1. Extrafacial expression of PD-L1 on melanoma cell-derived exosomes and its regulation by INF-γ.
a, A representative TEM image of purified WM9 cell exosomes. b, Characterization of purified exosomes by NanoSight nanoparticle tracking system. c, RPPA data showing the level of PD-L1 in the exosomes secreted by primary or metastatic melanoma cell lines (n = 3 for WM1552C, WM902B, A375, WM164, and n = 4 for WM35, WM793, UACC-903, WM9). See Extended Data Fig. 1a for statistical analysis. d, Immunoblots for PD-L1 in the whole cell lysate (“W”) and purified exosomes (“E”) from different metastatic melanoma cell lines. The same amounts of proteins in whole cell lysates and exosome were loaded. e, A representative TEM image of WM9 cell-derived exosomes immunogold-labeled with anti-PD-L1 antibodies. Arrowheads indicate 5-nm gold particles. f, Diagram of ELISA of exosomal PD-L1 (left panel). PD-L1 on the surface of exosomes was determined. See Methods for details. g, Levels of PD-L1 on exosomes from melanoma cells, with or without IFN-γ treatment, as measured by ELISA. h, PD-l binding of exosomes. See Methods for details. i, Western blot analysis of PD-L1 in exosomes from IFN-γ-treated cells (“IFN”) and control cells (“C”). The same amounts of exosome proteins were loaded (left panel). Quantification of exosomal PD-L1 by western blotting (right panel). The experiments were repeated three (a, b) or two (d, e) times independently with similar results obtained. Data represent mean ± s.d. of three (f, h, i) or four (g) independent biological replicates. Statistical analyses were performed using two-sided unpaired t-test (g, i). For source data (d, i), see Supplementary Fig. 1.

