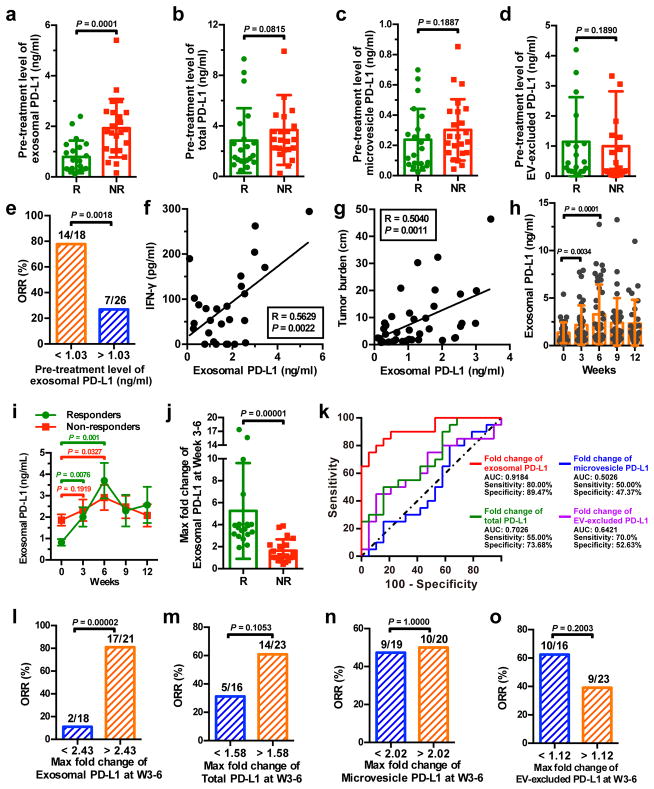
Figure 4. The level of circulating exosomal PD-L1 stratifies clinical responders from non-responders to pembrolizumab.
a-d, Comparison of the pre-treatment levels of circulating exosomal PD-L1 (a), total PD-L1 (b), microvesicle PD-L1 (c), or EV-excluded PD-L1 (d) between melanoma patients with or without clinical response to pembrolizumab (“R”: responders, n = 21; “NR”: non-responders, n = 23). e, Objective response rate (“ORR”) for patients with high and low pre-treatment levels of circulating exosomal PD-L1. f, g, Pearson correlation of the IFN-γ level (f, n = 27) or overall tumor burden (g, n = 39) to the exosomal PD-L1 level in the plasma of melanoma patients. h, The levels of circulating exosomal PD-L1 at serial time points pre- and on-treatment (n = 39). i, The levels of circulating exosomal PD-L1 in clinical responders (n = 19) and non-responders (n = 20) at serial time points pre- and on-treatment. j, Comparison of the maximum fold change of circulating exosomal PD-L1 at Week 3–6 between the clinical responders and non-responders. k, ROC curve analysis for the max fold change of circulating exosomal PD-L1 at Week 3–6 in clinical responders compared to non-responders. l-o, Objective response rate for patients with high and low fold changes of circulating exosomal PD-L1 (l), total PD-L1 (m), microvesicle PD-L1 (n), or EV-excluded PD-L1 (o). Data represent mean ± s.d. *P < 0.05, Statistical analyses were performed using two-sided unpaired t-test (a–d, j), two-sided paired t-test (h, i), or two-sided Fisher’s exact test (e, l–o).

