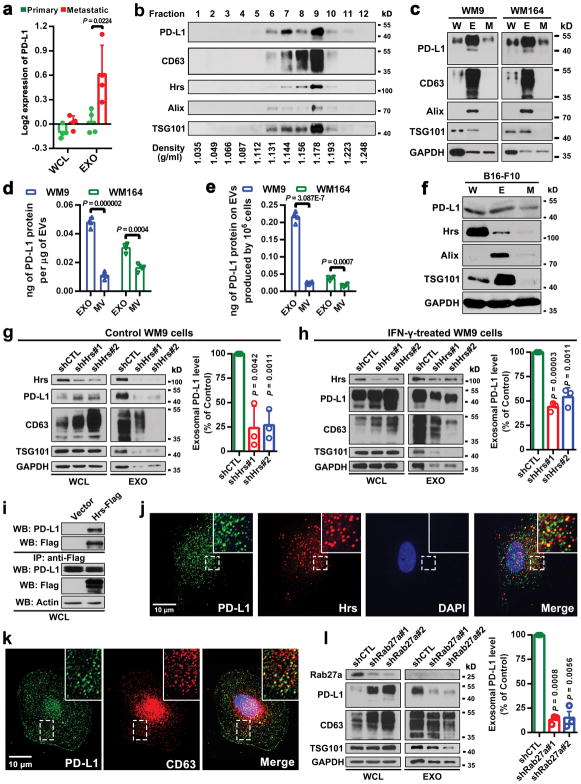
Extended Data Figure 1. Melanoma cells release EVs carrying PD-L1.
a, The Log2 transformed RPPA data showing a higher level of exosomal PD-L1 secreted by metastatic melanoma cell lines compared with primary melanoma cell lines. Data represent mean ± s.d. of four primary (WM1552C, WM35, WM793, WM902B) or metastatic (UACC-903, 1205Lu, WM9, WM164) melanoma lines. b, Density gradient centrifugation confirming that PD-L1 secreted by WM9 cells co-fractionated with exosome markers CD63, Hrs, Alix, and TSG101. c, Immunoblots for PD-L1 in the whole cell lysate (“W”), purified exosomes (“E”), or microvesicles (“M”) from different metastatic melanoma cell lines. The same protein amounts of whole cell lysates, exosome and microvesicle proteins were loaded. d, Levels of PD-L1 on the exosomes or microvesicles derived from melanoma cells as assayed by ELISA. e, The levels of exosomal PD-L1 and microvesicle PD-L1 produced by an equal number of melanoma cells. f, Immunoblots for PD-L1 in the whole cell lysate, purified exosomes or microvesicles from mouse melanoma B16-F10 cells. The same protein amounts of whole cell lysates, exosome and microvesicle proteins were loaded. g, h, Western blot analysis of PD-L1 in HRS knockdown cells without (g) or with (h) IFN-γ treatment. Quantification of the western blotting data (right panel). i, Co-immunoprecipitation of PD-L1 and Hrs from MEL624 cells expressing exogenous PD-L1 and Hrs. j, Immunofluorescence staining of intracellular PD-L1 and exosome marker Hrs in WM9 cells treated with IFN-γ. k, Immunofluorescence staining of intracellular PD-L1 and CD63 in WM9 cells treated with IFN-γ. l, Western blotting analysis showing intracellular accumulation of PD-L1, and decreased exosomal secretion of PD-L1 in WM9 cells with RAB27A knockdown (left). The levels of exosomal PD-L1 were compared (right). Two experiments were repeated independently with similar results (b, c, f, i–k). Data represent mean ± s.d. of four (d, e), or three (g, h, l) independent biological replicates. Statistical analysis is performed by two-sided unpaired t-test (a, d, e, g, h, l). For gel source data (b, c, f–i, l), see Supplementary Fig. 1.

