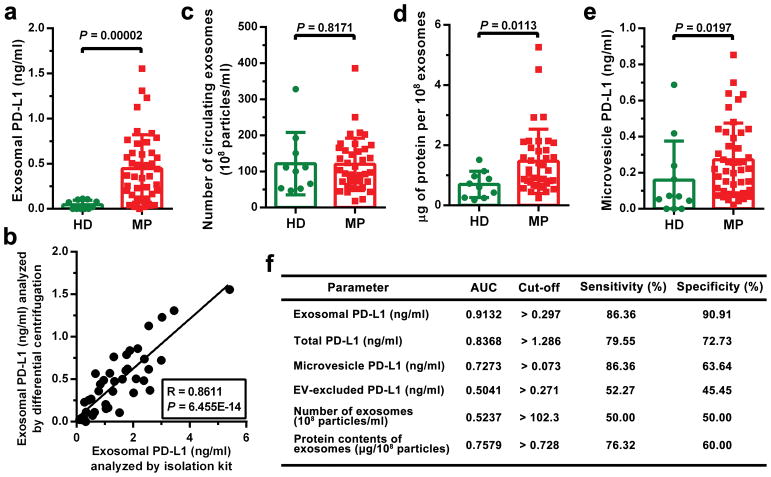
Extended Data Figure 3. The number or bulk protein level of circulating exosomes shows no or modest difference between healthy donors and patients with metastatic melanoma.
a, ELISA showing the level of PD-L1 on circulating exosomes purified from healthy donors (“HD”, n = 11) and melanoma patients (“MP”, n = 44). The exosomes were purified using differential centrifugation. b, Pearson correlation between the ELISA-detected levels of PD-L1 on circulating exosomes purified by differential centrifugation or using the commercial exosome isolation kit (n = 44). c, Comparison of the number of circulating exosomes between healthy donors (n = 10) and melanoma patients (n = 38). d, Comparison of the protein content of circulating exosomes between healthy donors (n = 10) and melanoma patients (n = 38). e, ELISA of the circulating level of microvesicle PD-L1 in healthy donors (“HD”, n = 11) and melanoma patients (“MP”, n = 44). f, Detailed data associated with the ROC curve analysis depicted in Fig. 2g. Data represent mean ± s.d. Statistical analyses are performed by two-sided unpaired t-test (a, c–e).

