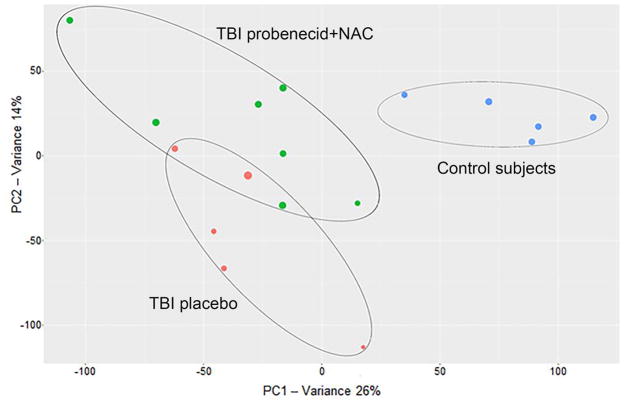
Figure 1.
PCA analysis based on the first two components shows clustering of the three study groups based on their difference in metabolic profile (blue = control subjects, red = TBI treated with placebo, green = TBI treated with probenecid+NAC). The diameter of each circle represents the DModX value, which indicates the observed distance of a particular individual to the principal components model. XCMS-online metabolomics platform (Scripps Research Institute, San Diego, CA)

