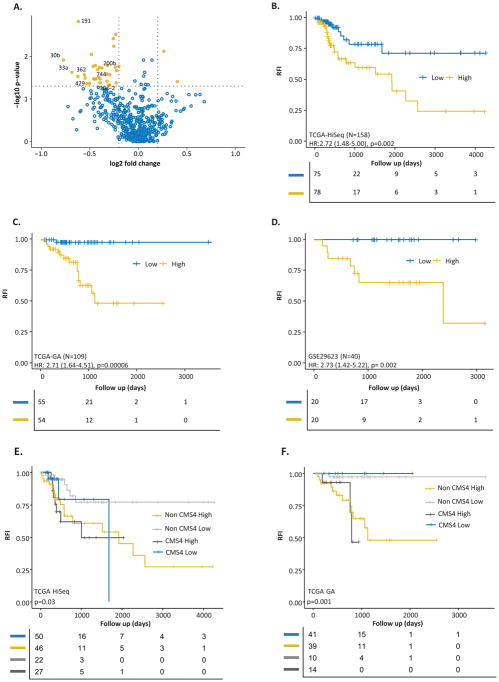
Figure 2.
A miRNA classifier Volcano plot and KM curves predicting recurrence-free interval in the TCGA discovery, validation and GSE validation cohorts. A) Volcano plot showing the significant and differentially regulated miRNAs selected in the TCGA discovery cohort. Selected miRNAs are depicted in the figure. The Kaplan Meier survival plots for recurrence-free interval stratified by MRC scores in the: B) TCGA discovery cohort (N=158), C) TCGA validation cohort (N=109), and D) the GSE29623 validation cohort (N=40). E) and F) The Kaplan Meier plots illustrating that both CMS4 and non-CMS4 patients with high miRNA risk scores exhibited shorter recurrence-free interval in the TCGA discovery and validation cohorts, respectively.

