
Figure 3.
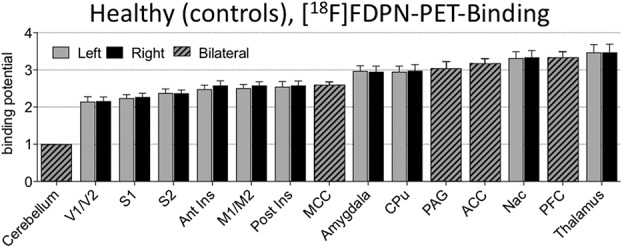
[18F]-FDPN tracer binding in the control rat brain to validate the tracer. Values displayed are normalized with the cerebellum as reference region, mean ± SD. A 1-way ANOVA contrasting all brain regions was found to be significant F22,368 = 284.251, P < 0.001 with post hoc analysis contrasting each brain region to the cerebellum found each region to be significantly different from the cerebellum, which is devoid of opioid receptors (P < 0.001). ACC, anterior cingulate cortex; ANOVA, analysis of variance; MCC, mid-cingulate cortex; PAG, periaqueductal gray; PET, positron emission tomography; PFC, prefrontal cortex.