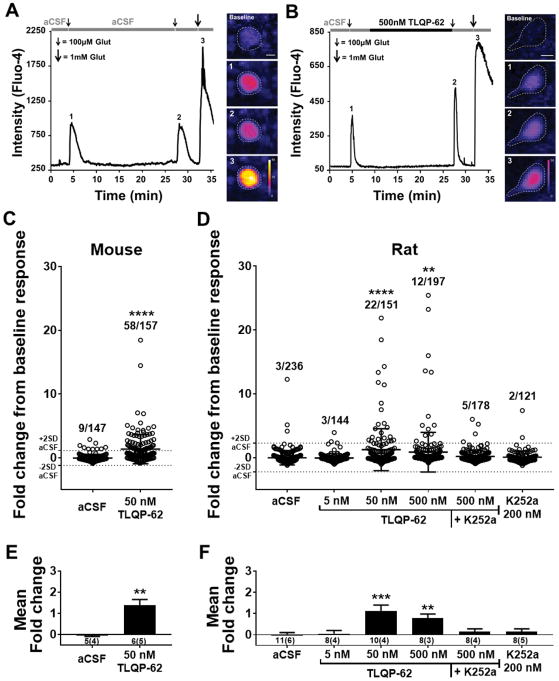
Figure 4. TLQP-62 potentiates neuronal glutamate responses in the dorsal horn.
A & B) The ability of TLQP-62 to potentiate submaximal glutamate responses was tested by measuring the change in intensity of the Ca2+ indicator Fluo-4 following glutamate exposure before (1) and after (2) 15-min incubation with aCSF (A) or TLQP-62 (B). Responses to 100 μM glutamate were shown to be submaximal by subsequent application of 1 mM glutamate (3). Incubation in aCSF resulted in submaximal glutamate responses of similar amplitude (A), while incubation with TLQP-62 yielded a notable increase in the amplitude of the second glutamate response, relative to the first (B). Scale bars = 10 μm. C & D) Scatter plots of the fold change in submaximal glutamate response from all glutamate responsive, Fluo-4+ neuronal profiles relative to baseline. The mean and 2SD envelope of the aCSF group are depicted by dotted lines. The proportion of Fluo-4+ neuronal profiles exhibiting a fold change > 2SD (ratio indicated above scatter) is significantly elevated following incubation with TLQP-62 at ≥ 50 nM in neuronal profiles of the superficial dorsal horn in transverse spinal cord slices derived from both mice (C) and rats (D). This effect is eliminated in the presence of the kinase inhibitor K252a (D). Lines and bars represent mean +/− SD; **, **** = P<0.01, P<0.0001 compared to aCSF by Fisher’s Exact test. E & F) Mean fold change of fluorescent intensity averaged across all glutamate responsive profiles imaged per animal (# animals = n) for mice (E) and rats (F). Bars represent mean +/− SEM, means and variance weighted for the number of slices per animal; number below x-axis details the number of slices and (number of animals) used in each group; E, ** = P<0.01 unpaired Student’s t-test; F, **, *** = P<0.01, P<0.001 compared to aCSF by one-way ANOVA with Dunnett’s post test.

