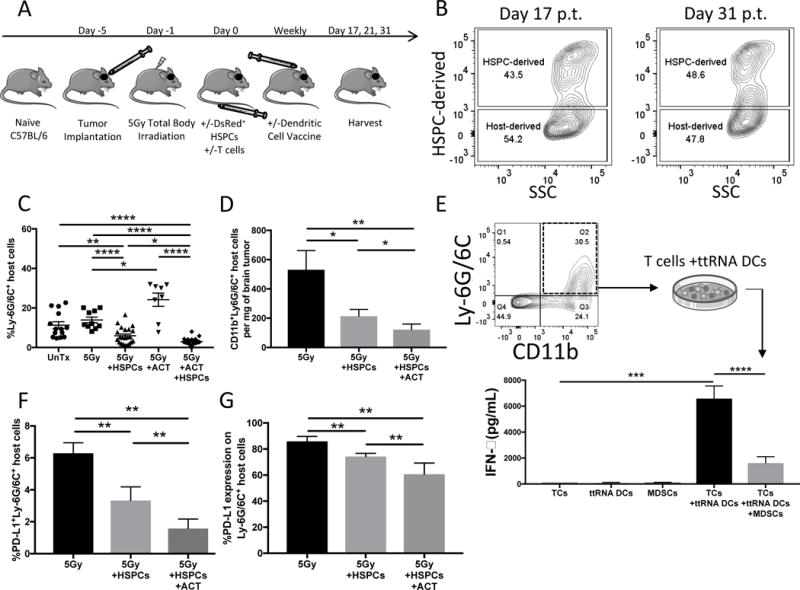
Figure 3. Host immunity in brain tumors during HSPC engraftment.

A). Experimental layout for remainder of in-vivo experiments including +/−HSPC transfer and +/−ACT (TCs with BMDC vaccine) following 5Gy non-myeloablative total body irradiation. Experimental plan similar to plan in Figure 1A but includes 5Gy irradiation instead of 9Gy to remove the requirement for HSPC transplant and DsRed+ HSPCs are administered to allow tracking of HSPC-derived cells (DsRed+) or Host-derived cells (DsRed−). B). Representative flow cytometry of brain tumors of animals harvested 17d and 31d post-ACT and 350,000 HSPCs. Experiment performed twice. C). Bar graphs represents flow cytometry of brain tumors of animals 21d post-treatment. Groups include untreated (n=14), 5Gy alone (n=10), 5Gy+HSPC transfer (n=22), 5Gy+ACT (n=8), or 5Gy+ACT+HSPC (n=24) transfer. Gated on all DsRed− host-derived cells. Data is pooled from >2 experiments and represents mean +/− SEM. Data from individual experiments is separated in supplemental fig. S1. D). Bar graph represents absolute cell count flow cytometry of brain tumors of animals 21d post-treatment with 5Gy alone (n=7), 5Gy+HSPCs (n=12), or 5Gy+HSPCs+ACT (n=15). Data is pooled from 2 experiments and represents mean +/− SEM. Gated on all DsRed− host-derived cells. Myeloid-derived suppressor cell (MDSC) marker was narrowed from Ly-6G/6C+ in Panel C to CD11b+Ly-6G/6C+ double-positive MDSCs. E). FACS-sorting of host-derived CD11b+Ly-6G/6C+ cells from brain tumors of mice 21d post-treatment with ACT without HSPCs. 40,000 FACS-sorted host-derived MDSCs were introduced into a co-culture restimulation assay with 40,000 ttRNA-pulsed DCs and 400,000 tumor-reactive T cells. 48h later an IFN-γ ELISA was performed on the supernatants to determined the degree to which host-derived MDSCs suppressed T cell activation by DCs. Experiment performed twice and data represents mean +/− SD. F). Bar graph represents flow cytometry of brain tumors 21d post-treatment with 5Gy, 5Gy+HSPCs or 5Gy+HSPCs+ACT. Data represents mean +/− SD of PD-L1+Ly-6G/6C+ host MDSCs. PD-L1 is a suppressive molecule found on tumor-infiltrating MDSCs. G). Further phenotypic characterization of host MDSCs. Bar graph represents flow cytometry percent expression of PD-L1 on the host Ly-6G/6C+ MDSC population in brain tumor. Data represents mean +/− SD. *P<.05, **P<.01, ***P<.001, ****P<.0001, by unpaired students t test for in-vitro studies (n=3) and by Mann-Whitney t test for in-vivo studies (n≥5).
