
Figure 6. Impact of IFN-γ on anti-tumor efficacy of HSPCs and ACT.
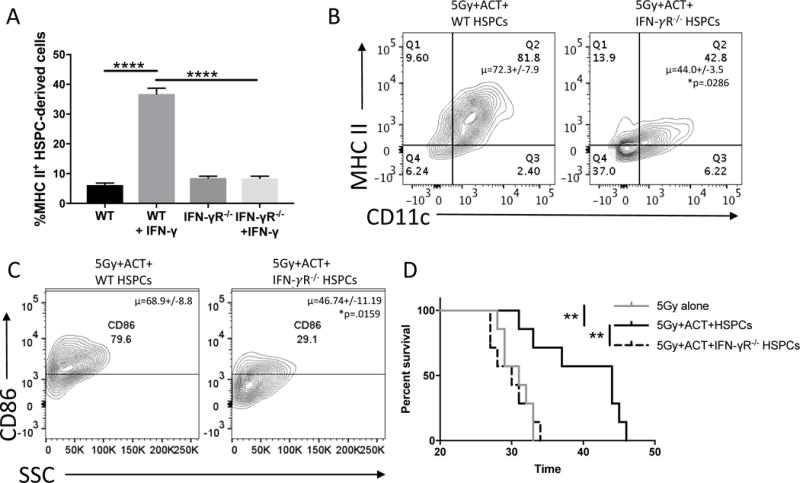
A). Bar graph represents flow cytometry of 3d. in-vitro culture of HSPCs either UnTx or with 125pg/mL IFN-γ. Groups on the left were performed with HSPCs from WT mice, groups on right were performed with HSPCs from IFN-γR−/− mice. Experiment performed twice. B). Representative flow cytometry of brain tumors of mice 21d post-treatment with 5Gy, ACT, and WT HSPCs or IFN-γR−/− HSPCs. Without IFN-γR, HSPC-derived cells have decreased CD11+MHCII+ co-expression indicating decreased DC phenotype. In this experiment, DsRed mice were the tumor-bearing hosts while WT mice or IFN-γR−/− mice were the source of HSPCs. This allowed tracking of HSPC-derived populations in the DsRed− compartment. Experiment performed twice. C). Representative flow cytometry of brain tumors of mice 21d post-treatment with 5Gy, ACT, and WT HSPCs or IFN-γR−/− HSPCs. Flow plots are analyzing CD86 expression on previously gated CD11c+MHCII+ HSPC-derived cells. Previous reports have indicated these co-stimulatory-expressing DCs are critical to brain immune responses. Experiment performed twice. D). Survival curve of brain tumor-bearing mice treated with 5Gy, 5Gy+ACT+HSPCs, or 5Gy+ACT+HSPCs from an IFN-γR−/− mouse. All data represent the mean +/−SD. *P<.05, **P<.01, ***P<.001, ****P<.0001, by unpaired students t test for in-vitro studies (n=3), by Mann-Whitney t test for in-vivo studies (n≥4) and Mantel-Cox Log Rank Test for survival experiments (n=7).