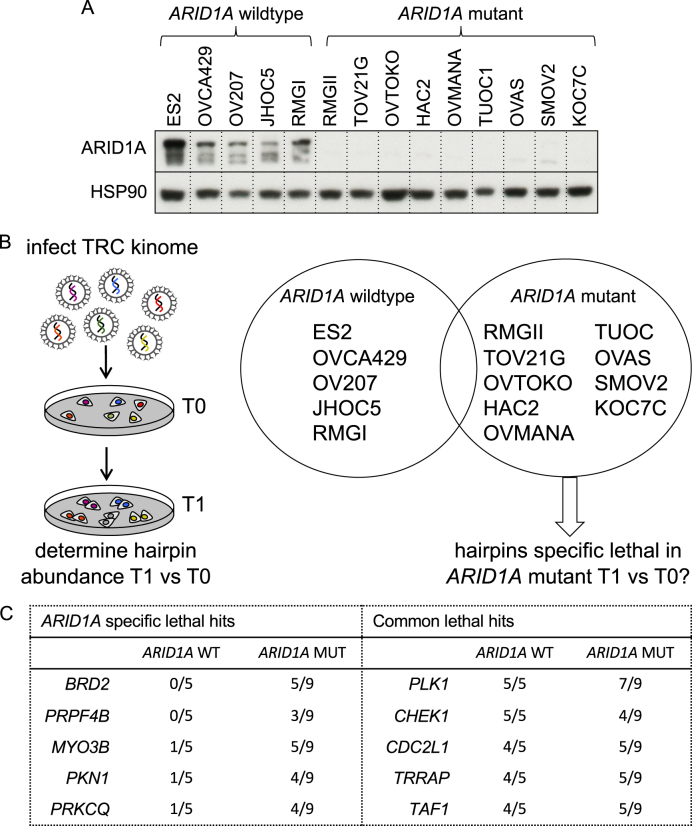
Fig. 1.
TRC kinome screen in OCCC cell panel. a ARID1A protein expression levels of the OCCC panel were measured by Western blot analysis. HSP90 was used as a loading control. b Each cell line from the OCCC panel was infected in triplicate with the lentiviral TRC kinome library with a multiplicity of infection below 0.5 and with cell amounts ensuring 1000× coverage of the library. Upon stable selection of the library timepoint zero (T0) was collected, followed by culturing of the cells for an additional two weeks, after which timepoint one (T1) was harvested. The relative abundance of the hairpins in T0 versus T1 was determined by deep sequencing. c Ranked lists for the lethal kinases were generated for every OCCC line based on three criteria (fold depletion, Geometric mean value of all hairpins and Second-best gene rank according to RIGER) as outlined in the methods section. From these ranked hit lists we determined which genes were lethal upon knockdown in all cell lines (common lethal hits) or preferentially in the ARID1A mutant lines (ARID1A specific lethal hits) and a top 5 is shown

