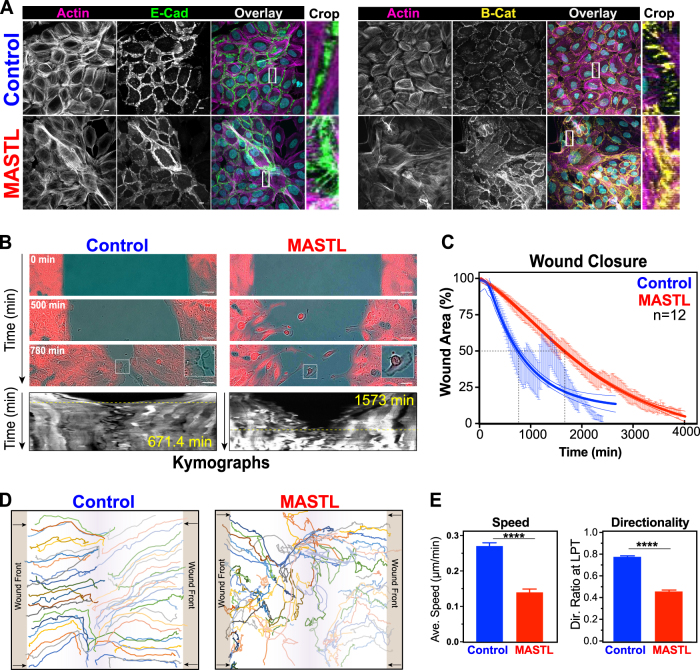
Fig. 4.
MASTL overexpression results in the loss of cell–cell junctions, causing migration defects. a Representative maximum projection images from confocal immunofluorescence of control and MASTL stained with H33342 (cyan) for E-Cadherin (green), β-catenin (yellow), and phalloidin (F-actin, pink). Scale bar 10 µm. b Wound-healing assays of control, and MASTL cell lines. Representative phase contrast, with inset of invading cell front (Control) and individual cells (MASTL) shown. Scale bar 50 µm. Kymographs (mCherry) generated by horizontal line through middle of wound area. Yellow dotted line indicates wound closure. c MRI Wound-Healing Tool for ImageJ was used to determine unclosed wound area as a function of time (mean ± SEM shown). Dotted line indicates 50% closure. Trend-line analysis performed using asymmetric sigmoidal analysis in Prism (R2 = 0.5888; Control and 0.7912; MASTL). d The MTrackJ plugin for ImageJ was used to track individual cells (n = minimum 50 cell/condition) from b. e Data from d were analysed using the DiPer software tool. Shown are average speed and directionality ratios for MASTL and controls from three independent experiments (mean ± SEM, unpaired t-test, ****p < 0.0001)

