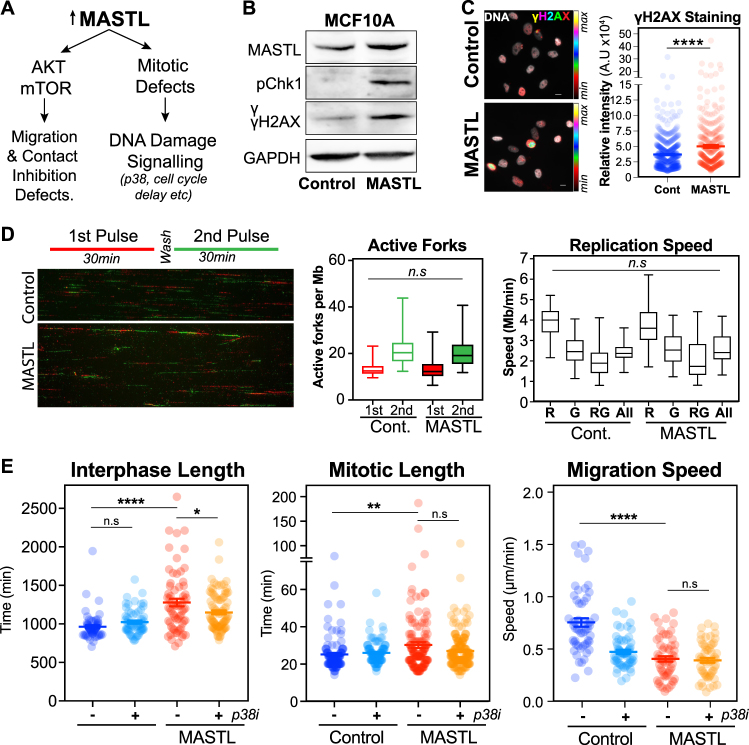
Fig. 6.
MASTL overexpression induces a G2 DNA damage checkpoint response. a Schematic of two major pathways disrupted by MASTL overexpression. b Western blot analysis of asynchronous MCF10A cells. c Immunofluorescence analysis of cells (minimum n = 1000) from b. Scale bar 10 µm. d DNA fibre analysis of cells from b. A minimum of 200 fibres were analysed using computer aided scoring and analysis (CASA) software. e Live-cell microscopy of the control and MASTL cells treated with or without 10 µm of SB203580 (p38i). Average interphase (from first anaphase to second NEBD), and mitotic length (NEBD to anaphase), are shown, along with migration analysis using MTrackJ and DiPer. Shown are mean ± SEM (one-way ANOVA Student's t-test, *p < 0.05, **p < 0.01, ***p < 0.001, ****p < 0.0001) for n = 50 and 100 cell for Control ± p38i and MASTL ± p38i, respectively

