Fig. 2.
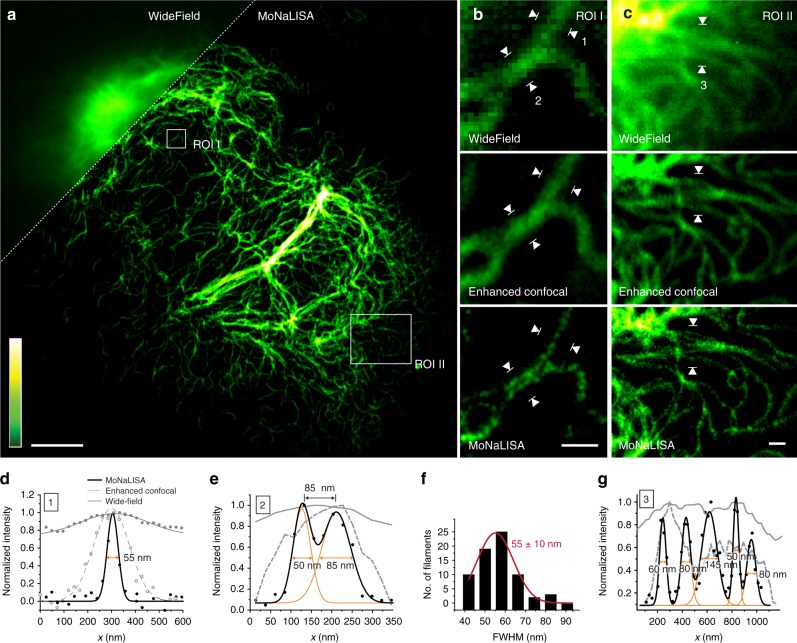
MoNaLISA nanoscale imaging. a Super-resolved image of endogenous vimentin-rsEGFP2 in comparison to the related wide-field image (inset). Scale bar 5 μm. b and c Magnified regions showing wide-field, enhanced confocal, and MoNaLISA images. Scale bar 500 nm. d Representative normalized intensity profiles (four lines averaged) measured across the filaments marked with white arrowheads no. 1 in b. Gaussian fits of the data show a FWHM of 55 ± 5 nm, 180 ± 10 nm, and 335 ± 45 nm for imaging in MoNaLISA, enhanced confocal, and wide-field mode, respectively (±s.e.m.). e Normalized intensity profiles (four lines averaged) measured across the filaments marked with white arrowheads no. 2 in b. The Gaussian fit for the two filaments shows a FWHM of 50 ± 5 nm and 85 ± 10 nm, respectively, and a separation of 85 ± 5 nm (±s.e.m.). f Histogram of 70 independent filament widths measured in image a, the mean value is 55 ± 10 nm (mean ± s.d.). g Normalized intensity profile measured in f across the white arrows. The MoNaLISA data shows five distinct filaments that cannot be resolved using confocal or widefield imaging

