Fig. 3.
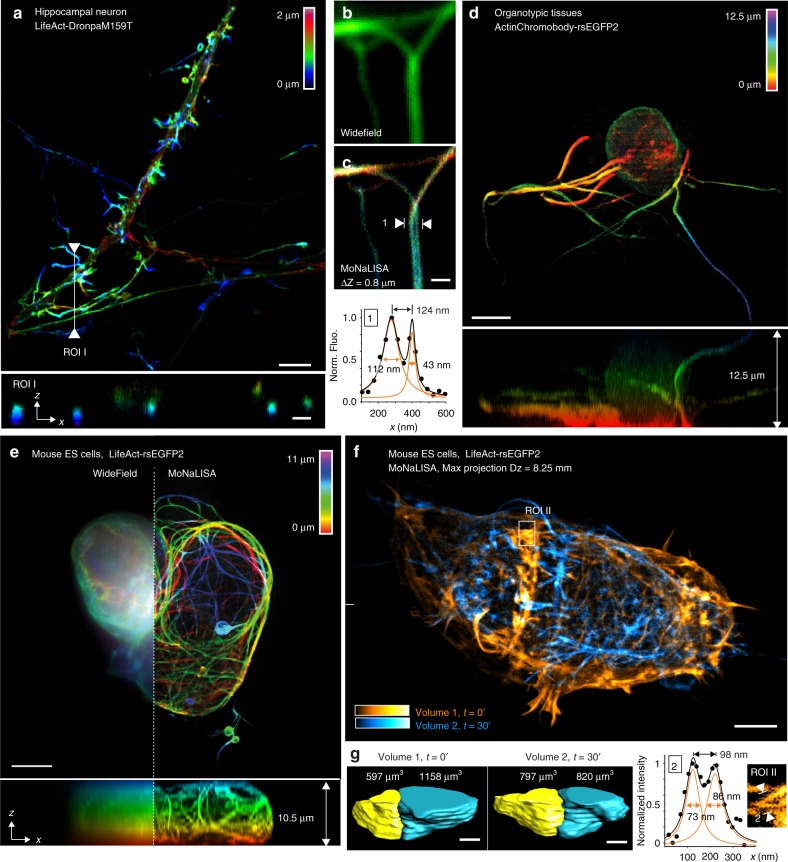
Optical sectioning and 3D recordings in living cells and organotypic tissues. a 3D stacks of 15 DIV neurons expressing LifeAct-DronpaM159T with MoNaLISA. The fine optical sectioning reveals the color-coded depth information in the x–y and x–z maximum projections. Scale bar, 5 μm. b and c Comparison between wide-field and MoNaLISA imaging of a neuron expressing LifeAct-rsEGFP2. The line profiles measured in the MoNaLISA image were averaged over four lines and fitted with a Gaussian. d Young brain cell recorded in an organotypic hippocampal rodent brain tissue and represented in an x–y and x–z maximum projection. Scale bars, 5 μm. e Colony of mouse ES cells spanning 30 × 30 × 11 µm3 imaged in the volumetric imaging mode. The scan steps are 35 nm in x–y and 500 nm in z. The images report fine structures across the entire z depth (right), hidden in the wide-field comparison (left). f Two volumes of mouse ES stem cells composed of 33 frames for a total axial depth of 8.25 μm has been recorded. The frame recording time was 2.9 s. We waited 30 min between volumes to observe the rearrangements of the actin network upon transfer to serum-free conditions. Scale bar, 5 μm. g The volumetric rendering of the two cells over time shows a clear shift in volume ratio in physiological (volume 1) versus the starving (volume 2) condition. ROI I is the magnified region of a single section and highlights fine actin bundles of sub-100 nm size

