Fig. 4.
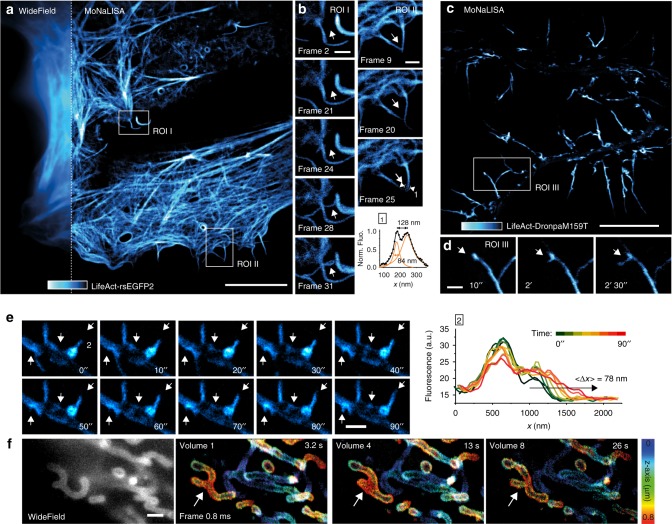
MoNaLISA time-lapse imaging. a Nanoscale imaging of epithelial cells expressing LifeAct-rsEGFP2 compared to the wide-field image (inset). Scale bar, 10 μm. b Magnified regions I and II unravel the dynamics of growing small filopodia observed over 3 min for a total of 45 frames, each acquired in 3.9 s. Scale bar, 1 μm. c Living hippocampal neurons infected with LifeAct-DronpaM159T showing the actin arrangements in dendrites and dendritic spines. Scale bar, 10 μm. d Magnified region III highlights the recruitment of actin molecules into a spine, which slowly enlarge its head into a cup-shape across 19 frames (left arrow), each acquired in 3.4 s. Scale bar, 1 μm. e Dynamics of dendritic filopodia emerging from actin densities in the dendritic shaft in neuron at 8 DIV. The arrows highlight the actin dynamics and redistribution. The graph shows the elongation over time of the filopodia 2 and reveals nanosized increments across time. Each line profile was averaged over a 100 nm width. f Nanoscale imaging of the mitochondria outer membrane labeled with rsEGFP2-Omp25. The mitochondrial volumetric dynamics are recorded continuously over seconds. The axial information is color-coded. Single frame recording 0.83 s, volume 3.3 s. Scale bar, 1 μm

