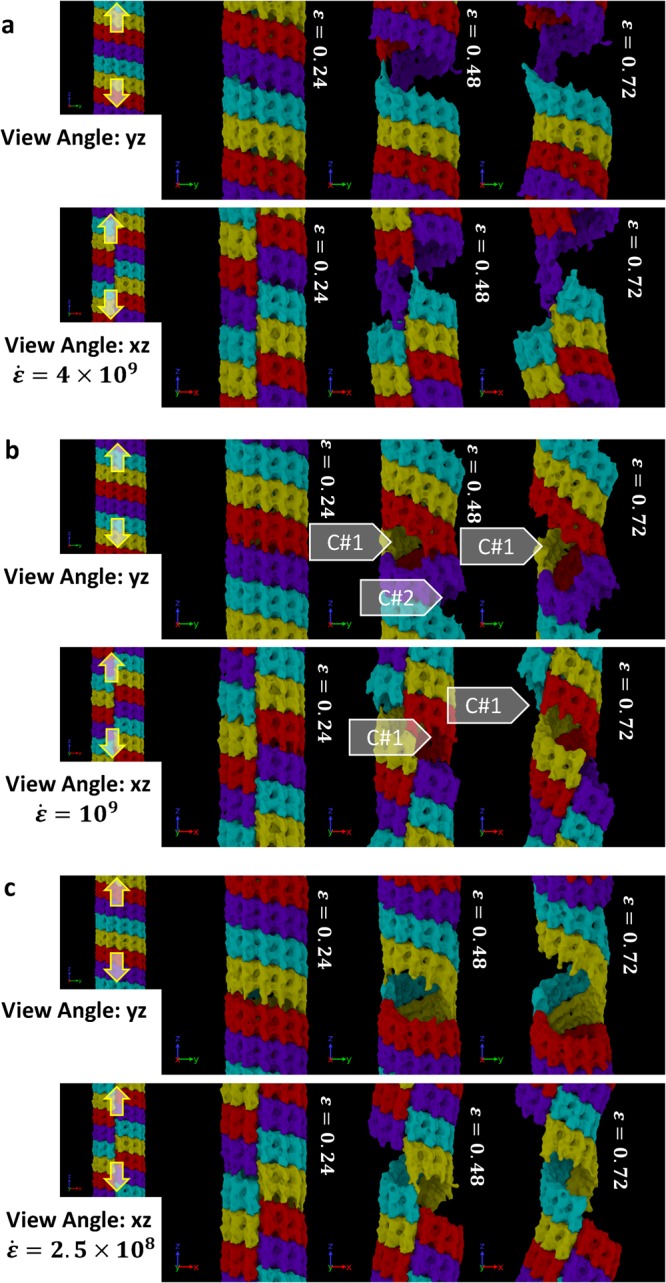
Figure 3.

Breaking pattern of MT molecules during axial stretch at different strain rates equal to (a) 4 × 10⁹ 1/s, (b) 1 × 10⁹ 1/s, and (c) 0.025 × 10⁹ 1/s. The filled arrow-heads point to the possible failure nucleation sites. The figures are showing more than one periodic images for visualizing the cracking site that cross the periodic boundary. Each periodic image contains 4 tubulin rings (marked in 4 different color). Note the rupture mechanisms of MT beyond ε = 0.24. Failure via inter-dimer (α–β) separation along the longitudinal direction is clearly visible.
