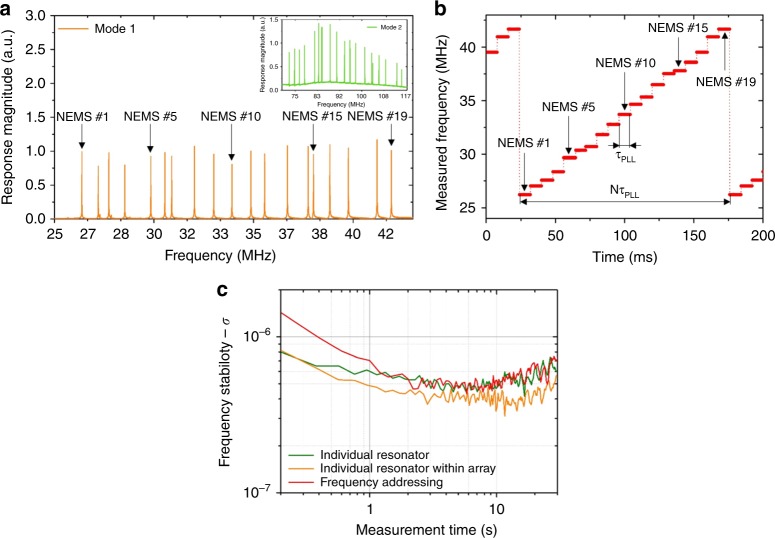
Fig. 2.
Frequency-addressing technique. a An open loop response of an array of 20 NEMS is recorded for mode 1 and mode 2 (inset). Each peak corresponds to the resonance of a single NEMS resonator for which resonance frequency and phase reference can be used as an address. We are showing here an example with only 19 resonance peaks: one resonator in the array failed after a long period of operation, as confirmed by scanning electron microscopy (SEM) observation. Yet, the array as a whole could still be operated without performance degradation, demonstrating the robustness of the parallel architecture. b The resonance frequency of every single resonator in the array is sequentially monitored over time: a PLL locks onto a given resonator, registers its current resonance frequency after a given idling time τPLL (here 8 ms) and then switches to the next resonator. The duty cycle of a whole array is then NτPLL (here 152 ms with N = 19 NEMS). From the recorded data points, individual frequency time traces can be extracted, and their frequency stability calculated. c Frequency stabilities obtained using a single individual resonator (not in array, green), a resonator of strictly identical dimensions within an array without frequency addressing (yellow) and the same resonator with frequency addressing (red). See “Frequency stability measurements” in the “Methods” for details on the selected frequency stability estimator. The three plots appeared identical within measurement uncertainty: the parallel architecture of our arrays along with the frequency-addressing technique allows reaching the regime where frequency fluctuations set the frequency stability limit of our resonators, down to similar values as single resonators17

