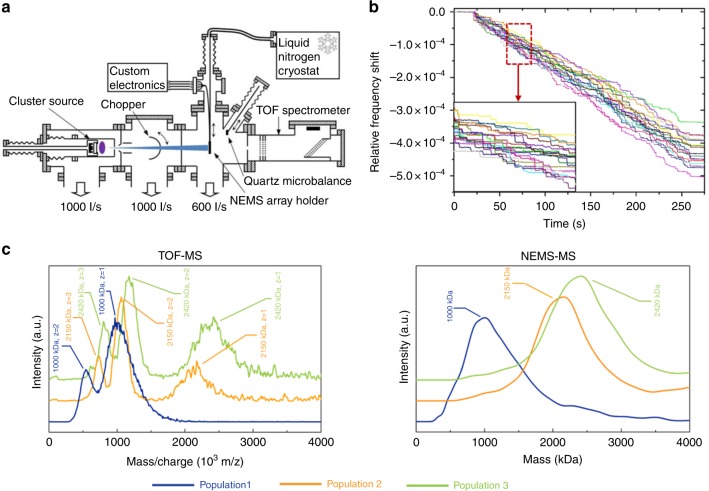
Fig. 3.
Single-particle Mass Spectrometry with arrays of nanoresonators. a Schematic of the setup showing from left to right: the cluster source, an intermediate chamber containing a chopper, the deposition chamber and an in-line TOF mass spectrometer. Both NEMS holder and QCM were retractable, allowing for sequential NEMS-MS, TOF-MS, and QCM measurements with the same operating conditions. b Mode 1 relative frequency time traces of an array of 19 NEMS exposed to a flux of tantalum nanoclusters with a mean diameter of 7.2 nm. Inset: zoom-in with frequency jumps induced by single-particle deposition. c Comparison of TOF and NEMS-MS with an array of 19 resonators performed with three distinct populations of nanoclusters with mean diameters of 5.8 nm (~1000 kDa), 7.4 nm (~2150 kDa), and 7.7 nm (~2420 kDa), respectively

