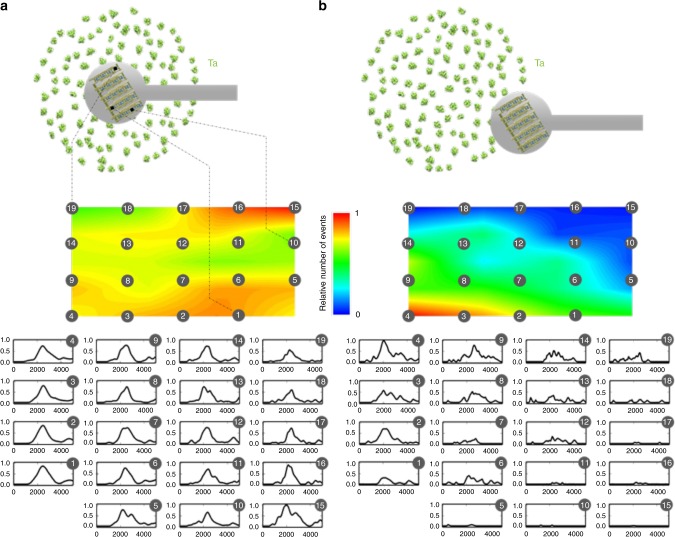
Fig. 4.
NEMS-MS beam imaging. The NEMS array is placed at the center of the particle beam (a) or at the edge (b). The event number is measured for each NEMS and plotted on interpolated surface maps for each case. Mass spectra obtained with each individual resonator for a 4 min acquisition are shown. A mechanical chopper is used to adapt the particle adsorption event rate to the array response time. The spectra are displayed as a matrix pattern reproducing the device physical layout (5×4). Each individual plot shows the intensity (a.u.) versus mass (kDa)

