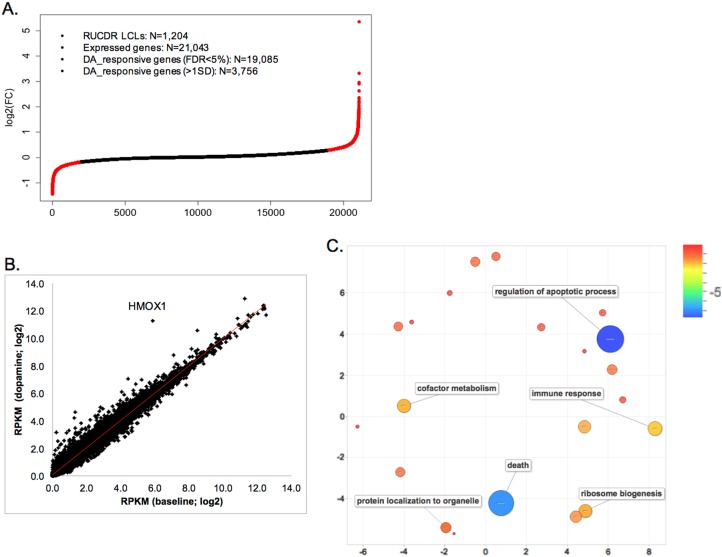
Fig. 3. DA-responsive genes in 1204 LCLs of MGS subjects.
a Distribution of expression fold change (FC) for all genes expressed in LCLs upon DA (100 μM) stimulation. An expressed gene was defined as having RPKM > 0 in at least 50% of baseline or DA-stimulated samples. Two-side paired Student’s t-test was used to test for DA response. The red dots show values for genes with log2 FC beyond the 1 SD cut off. b Gene expression before and after DA stimulation are highly correlated (Pearson R = 0.993). c GO-term enrichment analysis by DAVID. The enriched GO-terms were clustered and visualized by REVIGO50. Scale bar = log(FDR), blue indicates the most significant enrichment

