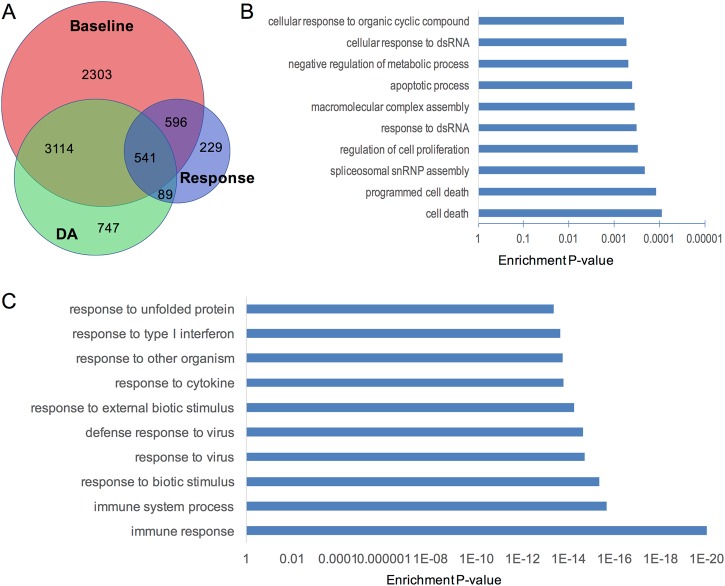
Fig. 4. Genes showing SZ-associated differential expression under different conditions and the enriched gene ontology terms.
a Venn diagram that shows the overlap of genes showing SZ-associated differential DA response, differentially expressed genes in baseline and under DA stimulation. b 229 genes that only showed SZ-associated differential response to DA are highly enriched for GO-terms related to cell death. c 541 genes that showed SZ-associated differential expression in all three analyses are highly enriched for GO-terms related to immune response and response to virus

