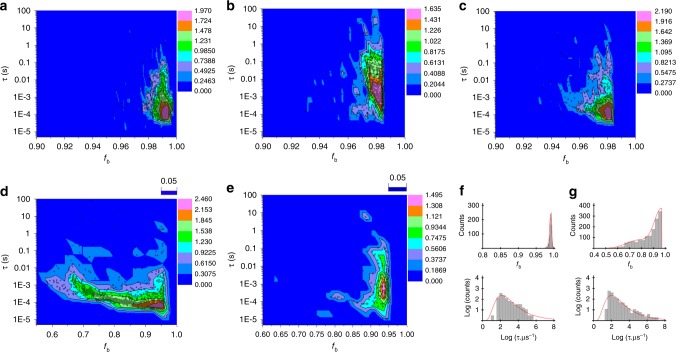
Fig. 3.
Heat maps with superimposed scatter plots of alginate-induced events. Event counts (plotted as log10 on the color axis) of a 4 µL 0.2% (w/v) A1 using a ~19 nm diameter pore (~0.321 events·s−1), b 20 µL of 3% (w/v) A2 using a ~21 nm (~0.046 events·s−1) and c 20 µL of 10-minute enzyme digested 3% (w/v) A2 using a ~22 nm diameter pore (~0.112 events·s−1), all in pH ~7 buffered 1 M KCl. The experiment in a was repeated d using a ~5 nm nanopore (~0.403 events·s−1), and e an ~18 nm-diameter pore, but in 0.1 M KCl (vs. 1 M KCl in a) electrolyte buffered at pH ~7 (~0.0527 events·s−1). The plots in f and g show histograms of the data (the red lines show fits to the data) in a and d, respectively, with additional plots in Supplementary Fig. 4. The applied voltage difference was −200 mV for all measurements

