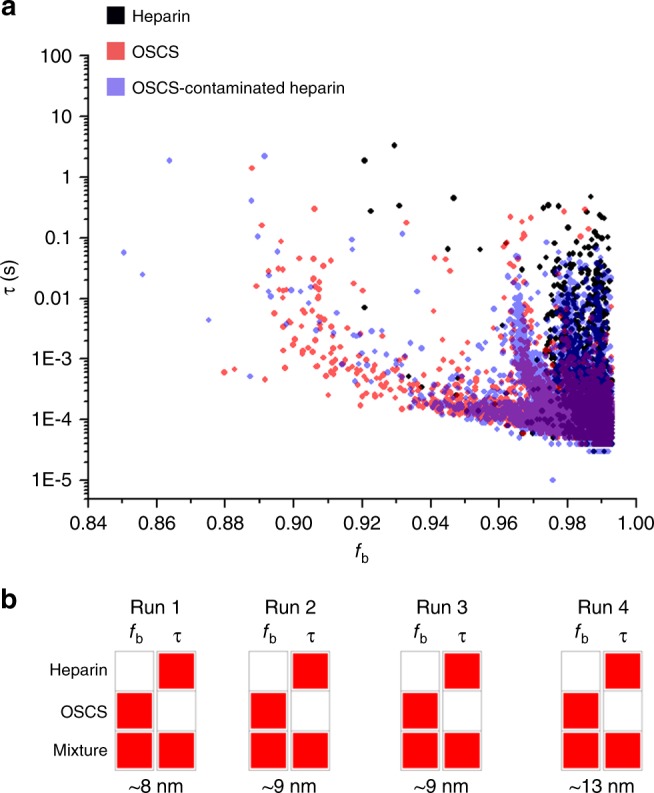
Fig. 5.

Nanopore resistive-pulse analysis of heparin, OSCS, and their mixture. a Superimposed scatter plots of 16 ppm heparin, OSCS and OSCS-contaminated heparin added to 4 M potassium chloride at +200 mV and measured using a ~13 nm pore. The colors in the legend correspond to the listed sample, and are blended (using transparency) in the plot where events from different samples overlap. b Recognition flags of heparin, OSCS and their mixture from four independent trials accurately identify the presence of the OSCS aliquot in the mixture. The red squares denote recognition of a species from the distribution of the corresponding property (column)
